observIQ Announces General Availability of Open Source Observability Solution BindPlane OP
Manages thousands of agents in one control panel, with enhanced filters to reduce data for greater control, lower costs.


The latest News and Information on Monitoring for Websites, Applications, APIs, Infrastructure, and other technologies.
When building systems that need to scale above a certain number of users, we usually can’t stay on one machine. This is where cloud providers like AWS usually come into play. They allow us to rent VMs or containers for small intervals. This way, we can start a few different machines when more traffic hits, and when it goes down later, we can simply turn off our extra capacity and save money. The question is, how does all this traffic get to our new machines? AWS Elastic Load Balancing!
There have been amazing articles on the subjects of migrating from a monolith to a microservice architecture e.g. this is probably one of the better examples. The benefits and drawbacks of the architectures should be pretty clear. I want to talk about something else though: the strategy. We build monoliths since they are easier to get started with. Microservices usually rise out of necessity when our system is already in production.
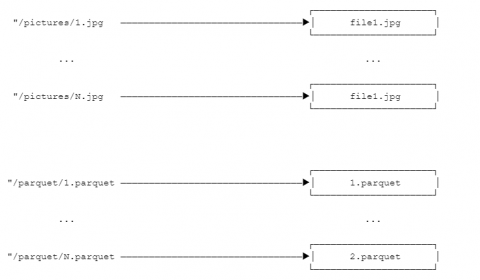
Today we are happy to officially announce that InfluxData has donated a generic object store implementation to the Apache Arrow project. Using this crate, the same code can easily interact with AWS S3, Azure Blob Storage, Google Cloud Storage, local files, memory, and more by a simple runtime configuration change. You can find the latest release on crates.io. We expect this will accelerate the pace of innovation within the Rust ecosystem.
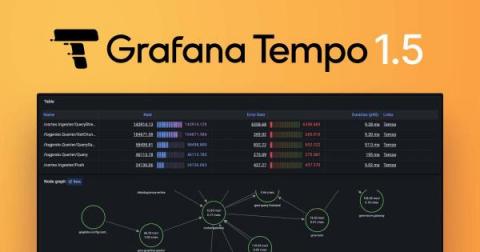
Grafana Tempo 1.5 has been released with a number of new features. In particular, we are excited that this is the first release with experimental support for the new Parquet-based columnar store. Read on to get a high-level overview of all the new changes in Grafana Tempo! If you’re a glutton for punishment, you can also dig into the hairy details of the changelog.
When we say “logs” we really mean any kind of time-series data: events, social media, you name it. See Jordan Sissel’s definition of time + data. And when we talk about autoscaling, what we really want is a hands-off approach at handling Elasticsearch/OpenSearch clusters. In this post, we’ll show you how to use a Kubernetes Operator to autoscale Elasticsearch clusters, going through the following with just a few commands.
In this post, we’ll look at how you can use OpenTelemetry to monitor your unit tests and send that data to Honeycomb to visualize. It’s important to note that you don’t need to adopt Honeycomb, or even OpenTelemetry, in your production application to get the benefit of tracing. This example uses OpenTelemetry purely in the test project and provides great insights into our customer’s code. We’re going to use xUnit as the runner and framework for our tests.
When it comes to a website’s performance, we all know the universal rule: speed matters… a lot. Beyond a good user experience, it’s a key factor in what Google is specifically looking—and testing—for. If you need a refresher, here it is, straight from Google: And what exactly does Google consider fast?