Operations | Monitoring | ITSM | DevOps | Cloud

The latest News and Information on Monitoring for Websites, Applications, APIs, Infrastructure, and other technologies.

How to Fix Source Map Upload Errors

A stack trace lacking your source code with all the variables and function names, is like putting together a jigsaw puzzle without a picture for reference. You have all these randomly shaped pieces but no way to know how they fit together. Unless you are fluent in computer, making sense of a JavaScript stack trace with minified code is going to make debugging very difficult. Thankfully, by uploading source maps to Sentry, you can map back to the original source code to make sense of what went wrong.

Best practices for instrumenting OpenTelemetry

OpenTelemetry (OTel) is steadily gaining broad industry adoption. As one of the major Cloud Native Computing Foundation (CNCF) projects, with as many commits as Kubernetes, it is gaining support from major ISVs and cloud providers delivering support for the framework. Many global companies from finance, insurance, tech, and other industries are starting to standardize on OpenTelemetry.

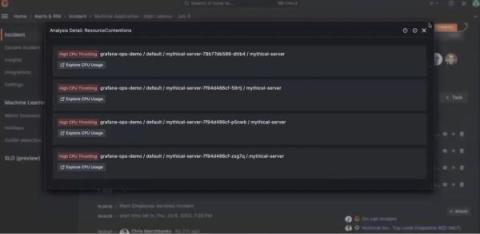
Announcing Sift: automated system checks for faster incident response times in Grafana Cloud

When faced with an incident, there are two areas that demand your immediate attention: the incident investigation, and the cross-functional coordination needed to resolve the issue. Grafana Incident helps with the collaboration by providing a central hub for communication across teams that seamlessly integrates with the tools you are already using, such as Slack or Microsoft Teams. But how can you best use your telemetry data to debug your application and bring your systems back online?

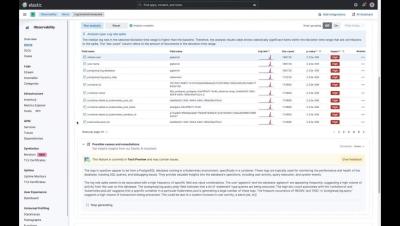
Elastic AI Assistant for Observability

Harness the power of generative AI to turn insights into actions. Powered by the Elasticsearch Relevance Engine™ (ESRE™), Elastic’s AI Assistant (in technical preview for Observability) transforms problem identification and resolution by eliminating manual data chasing across silos to an interactive assistant that delivers accurate and context-aware remediation for SREs.

Heartbeat Monitoring With Checkly

Today’s a big day at Checkly; we’re thrilled to announce that next to Browser and API checks we released a brand new check type to monitor your apps — say “Hello” to Heartbeat checks! In the realm of software, ensuring uninterrupted functionality is critical. While synthetic monitoring helps you discover user-facing problems early, keeping a close eye on the signals coming from your backend can be just as vital.

Too Many Alarms? Take Advantage of Custom Situations

As IT infrastructures become increasingly complex to monitor and manage –with new compelling technologies such as virtual machines, software-defined networks and containers overlaid onto existing technology stacks– IT operations teams face the additional challenge of nearly unmanageable ticket volumes. Ticket prioritization, correlation, redundancies and sheer speed of ticket generation become problems in and of themselves.

Icinga enables scientific research at Leibniz Supercomputing Centre

We are proud of our many customers and users around the globe that trust Icinga for critical IT infrastructure monitoring. That´s why we´re now showcasing some of these enterprises with their Success stories. It´s stories from companies or organizations just like yours, of any size and different kinds of industries. Some of them are our long-standing customers, others have just recently profited from migrating from another solution to Icinga.

Auto Filter Messages into Subscriptions in Azure Service Bus Topic

Topic is a logical channel to which publishers send messages. Topics can be employed when several subscribers wish to subscribe to a specific set of messages. Messages sent to a topic are then forwarded to its associated Subscriptions.