The latest News and Information on Monitoring for Websites, Applications, APIs, Infrastructure, and other technologies.
This article will focus on the popular monitoring tool Prometheus, and how to use PromQL. Prometheus uses Golang and allows simultaneous monitoring of many services and systems. In order to enable better monitoring of these multi-component systems, Prometheus has strong built-in data storage and tagging functionalities. To use PromQL to query these metrics you need to understand the architecture of data storage in Prometheus, and how the metric naming and tagging works.
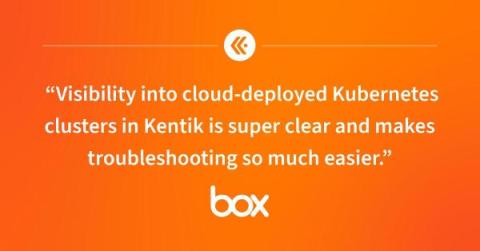
Tools and partners can make or break the cloud migration process. Read how Box used Kentik to make their Google Cloud migration successful.
In today's cloud-native landscapes, observability is more than a buzzword; it's a critical element for software development teams looking to master the complexities of modern environments like Kubernetes. There’s a multi-faceted nature to observability with all its various levels and dimensions — from basic metrics to comprehensive business insights. It’s complex and can continue indefinitely…if you let it.
Receiving the TRUE certification is a significant milestone for ScienceLogic, but it's just one step in our ongoing journey.
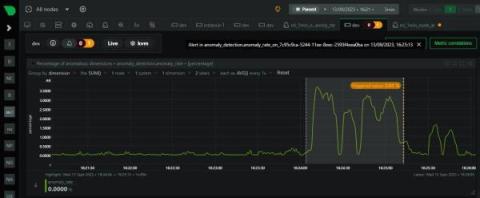
Over the last few years we have slowly and methodically been building out the ML based capabilities of the Netdata agent, dogfooding and iterating as we go. To date, these features have mostly been somewhat reactive and tools to aid once you are already troubleshooting. Now we feel we are ready to take a first gentle step into some more proactive use cases, starting with a simple node level anomaly rate alert. note You can read a bit more about our ML journey in our ML related blog posts.