Operations | Monitoring | ITSM | DevOps | Cloud

The latest News and Information on DevOps, CI/CD, Automation and related technologies.

Infrastructure monitoring consolidation for achieving agile IT management

Managing large-scale deployments efficiently and resolving issues in a timely manner can be an easy task. What you need is a reliable and agile set of infrastructure monitoring tools for your enterprise IT infrastructure that possesses all the needed features for simple and stress-free management.

Docker Hub rate limits in Bitbucket Pipelines

Docker recently announced that, starting November 1 2020, pull rate limits will apply to anonymous image pulls from Docker Hub. For anonymous (unauthenticated) users, pull rates are limited based on the individual IP address, and therefore some service disruption was expected for Docker Hub users. Bitbucket is working with Docker to ensure that Bitbucket Pipelines users can continue transparently using Docker Hub without rate limits nor any configuration.

Lessons Learned in CI/CD Transformation

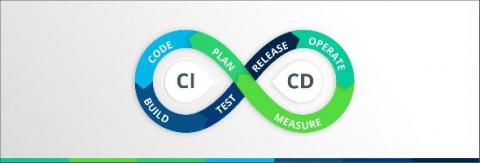
Continuous integration/continuous delivery (CI/CD) is a methodology which helps technology teams deliver higher-quality software faster through automation. At OpsRamp, we have embarked on the journey of CI/CD transformation and have seen tremendous change in the way we build and release our products. Michael Fisher, Group Product Manager, OpsRamp explained the journey and lessons learned in this process during a recent webinar.

Introducing etrace - a multi-purpose application profiling tool

These days, the internal workings of Linux applications involve many different moving parts. Sometimes, it can be rather difficult to debug them when things go wrong or run slower than expected. Tracing an application’s execution is one way of understanding potential issues without diving into the source code. To this end, we wrote an app-tracing tool called etrace, designed to detect performance bottlenecks and runtime issues in snaps.

Introducing composite charts and Metric Correlations

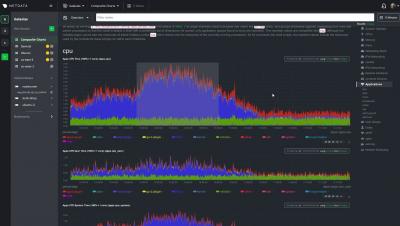
We're really excited about supercharging Netdata Cloud's infrastructure monitoring experience with composite charts. These charts look just like the ones you're familiar with, but feature real-time, per-second aggregated metrics from any number of distributed nodes from across your infrastructure. You can still pan, zoom, and highlight to your heart's content while also changing the aggregate function, filtering nodes, or jumping straight into single-node dashboards for root cause analysis.