Mailchimp
Not subscribed to OpsMatters Newsletter


For Azure Virtual Desktop (AVD) sessions, Microsoft exposes a set of user experience and graphics performance counters that eG Enterprise monitors out-of-the-box. These performance counters for Azure Virtual Desktop and Remote Desktop Protocol (RDP) / RemoteFX sessions can be used to troubleshoot AVD problems.
While Grafana is one of the better known names in the industry, Coralogix offers a full-stack observability platform. Despite the popularity of the Grafana brand, the cloud based solution lacks in some key areas. This article will go over the differences between Coralogix and Grafana Cloud, from features, customer support, pricing and more.
As a business owner or manager, you understand the importance of efficient operations and effective communication, particularly after hours. You want to equip your on-call engineers with all the information they need to resolve a ticket when not at their desk. If you are using ConnectWise to manage your service tickets – here is some great addition to help with your after hours alerting.
Maintaining high customer satisfaction is one of the most important parts of running a business, and part of keeping your customers happy is keeping them updated. This is especially critical for e-commerce or other digital services businesses, as some customers may not think they are as transparent as in-person stores. Status pages provide real-time and accurate information on the health and performance of your online services.
As software engineers, we all know that troubleshooting often involves sifting through heaps of data points — scanning metrics, reading logs, checking resource status and analyzing events. We manually connect the dots, and if we're experienced enough, we might spot an issue that's about to become a problem. At StackState, we've faced these same challenges.
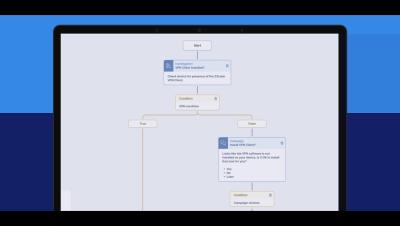
Learn more about Nexthink Flow: https://nexthink.com/platform/flow