Operations | Monitoring | ITSM | DevOps | Cloud

Monitoring

The latest News and Information on Monitoring for Websites, Applications, APIs, Infrastructure, and other technologies.

Elastic Observability 8.6: Maximizing operational efficiencies with improved application analysis and workflow integrations

Elastic Observability 8.6 introduces a set of capabilities improving production operations through the introduction of host (EC2/GCP compute/Azure compute) observability, application dependency operations views (insights into databases, caches, etc), and a new connector for Opsgenie. These new features allow customers to: Elastic Observability 8.6 is available now on Elastic Cloud — the only hosted Elasticsearch offering to include all of the new features in this latest release.

Time Zones: A Logger's Worst Nightmare

When working with log messages, it’s critical that the timestamp of the log message is accurate. Incorrect timestamps can cause problems when trying to find log messages at a specific date/time or may cause alerts to not function properly. A common cause of incorrect timestamps for log messages is a mismatch of time zones between the log source (device sending the log) and log destination (device receiving the log, such as Graylog).

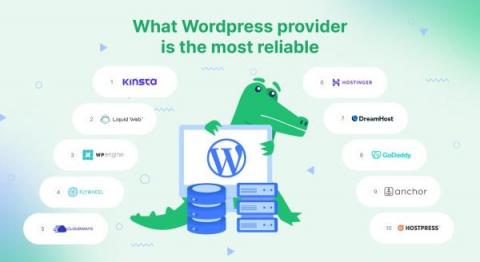
The Most Reliable WordPress Hosting Providers. The Study Based on Real Outage Data

According to data from W3Techs, more than 40% of all websites are built on WordPress. Therefore, it’s no surprise that WordPress hosting has skyrocketed in popularity recently and hosting providers have proliferated. With so many choices, it’s important to understand just how reliable WordPress hosts are, especially when it comes to downtime. Web hosting downtime can have significant consequences such as business loss, brand damage, and missed opportunities.

The Importance of Observability

While IT pros know they need to monitor IT services, they also know it can be the most difficult part of their job. Traditionally, enterprises have cobbled together several disparate monitoring products to address all their monitoring needs – but there are often gaps. Within these gaps, issues are missed, and the possibility of proactive issue resolution becomes nearly impossible.

What Databases Taught Me About Scaling Observability

I recently attended a virtual event and heard the speaker comment, “Relational databases don’t scale.” To my ears, this is about as silly a statement as saying, “No one can eat 26 hot dogs in 12 minutes” right before Kobayashi shows up and eats 50. In my experience, relational databases scale when they’re placed in the hands of someone who knows what they’re doing. Just imagine if Kobayashi was your data architect!

Centralized Logging with Open Source Tools - OpenTelemetry and SigNoz

Modern-day software systems emit millions of log lines per minute. Cloud computing and containerization have made it easy to have distributed systems. Distributed systems emit logs from multiple sources. While developers have always used logs to debug stand-alone applications, centralized logging solves the challenges of modern-day distributed software systems.

How OpenTelemetry Powers Observability @ Canva

Canva is an online design platform with a mission to empower everyone in the world to design anything and publish anywhere. To guarantee our customers have the best experience using our products, Canva engineers rely on the tools and products provided by the Observability team to measure and quantify critical application health and performance metrics. Canva’s Observability team uses OpenTelemetry components to collect, transform and export standardised telemetry data from our applications and platforms. Canva has been an early adopter of OTel using OTel SDK for tracing and the collector gateway to process and export telemetry to various tools. In this talk we’ll take a deeper look at how Canva uses OTel in our current observability workflows.

The "New Last Mile" of the Office Network

The office network has been in a near-constant state of evolution since dumb terminals and token rings. MPLS unlocked the ability to connect LANs. VPNs allowed end-users to work remotely while still being behind the firewall. Wi-Fi made intra-office travel easy and lessened reliance on extensive cabling. The WAN is slowly giving way to SD-WAN. New software and cloud-based networking componentry are allowing vendors to reimagine firewalls and routing.

4 New AWS Monitoring Dashboards for EC2, EBS, RDS and S3

This is just a quick blog to draw attention to some new and enhanced monitoring dashboards we have added to eG Enterprise in the upcoming release (v 7.2) to provide quick and powerful overviews of a range of AWS services. As with all our dashboards, color-coded overlays provide guided drilldown for help desk operators and administrators. If a component has an issue, an amber or red indicator is overlaid to allow the viewer to click through to further diagnostic information.

It's Time To Stop Pitting On Prem and Cloud Against Each Other

Most sentences that include both on premises and cloud usually put the word “or” between them, or perhaps “vs.” But most enterprises operate in the world of “and.” In other words, they have workloads on premises and in the cloud—and that little three-letter word makes a world of difference.