Operations | Monitoring | ITSM | DevOps | Cloud
Monitoring
The latest News and Information on Monitoring for Websites, Applications, APIs, Infrastructure, and other technologies.
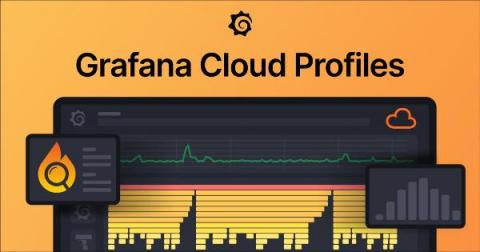
Continuous profiling now in public preview in Grafana Cloud
When we announced that Pyroscope was joining Grafana Labs back in March, we expressed our excitement that uniting the Pyroscope and Phlare open source projects and teams would accelerate our plan to add continuous profiling to Grafana Cloud. Just two and a half months later, that day has come! We are proud to announce that Grafana Cloud Profiles is now available in public preview for all Grafana Cloud users, both paid and free.
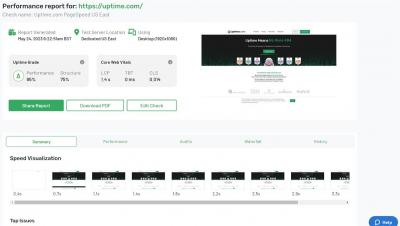
Page Speed Check
Check out our 14-day free trial, no credit card required: https://uptime.com/accounts/register
#monitoring, #saas, #downtime, #uptime, #nomore404, #outage, #enterprisesbusiness
IPL: How to use ipl-validator
In my last blogpost I explained how our ipl-html lib works and how to use it. With the help of ipl-html it is possible to add forms. Usually we want to validate the data of the form before submitting it and display messages if the validation fails. For this purpose, we have introduced the ipl-validator. The ipl-validator includes many useful validators, and today I want to explain how you can easily use them.
Install Graphite: Common Issues
Graphite is a very popular enterprise monitoring tool. This article will address the common issues that occur while setting up a Graphite instance, and how they can be avoided. We will assume readers have already become acquainted with Graphite, but if you’re interested to learn about the basics of Graphite, check out our articles on the Architecture and Concepts of Graphite and the Installation and Setup before reading this article.
Open Source Monitoring vs Proprietary Software
It’s easy to get pulled into paying more and more at a major monitoring company, despite not getting the functionality that you’re looking for. Leaving your monitoring provider can be difficult because it means replacing expensive software or hardware, re-educating your team, and transferring huge amounts of data to a new system - data that may or may not be well suited to the new system. Despite these issues, there are many reasons that motivate users to move to open source.
Collecting Kubernetes Data Using OpenTelemetry
Running a Kubernetes cluster isn’t easy. With all the benefits come complexities and unknowns. In order to truly understand your Kubernetes cluster and all the resources running inside, you need access to the treasure trove of telemetry that Kubernetes provides. With the right tools, you can get access to all the events, logs, and metrics of all the nodes, pods, containers, etc. running in your cluster. So which tool should you choose?
Microsoft Outlook on the web Outage, June 6th, MO572252
Yesterday’s Microsoft 365 Suite-wide outages, led to continual faults for Outlook on the web on Tuesday, June 6th. When the outages pile up, it becomes difficult to tell when one starts and the other ends. The latest: Can’t access Outlook on the web and other Microsoft services and features The prior day incidents began with EX571516: Some users are unable to access Outlook on the web, and may experience issues with other Exchange Online services.
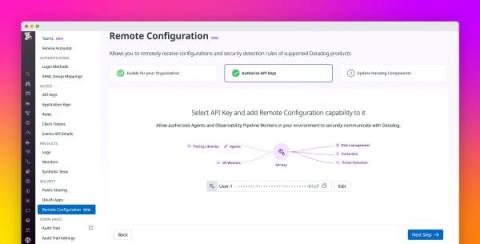
Apply real-time updates to Datadog components with Remote Configuration
Datadog provides you with a comprehensive and highly customizable platform for monitoring the performance and security of your applications. Through Datadog components deployed in your environment—including the Agent, tracing libraries, and Observability Pipelines workers—you can easily configure monitoring across your hosts and services, regardless of the particular technology you’re using.
Unlocking end-to-end observability: Cisco's game-changing solution
Integrating network intelligence and application observability, our latest Customer Digital Experience Monitoring enhancement enables end-to-end visibility and eliminates silos.


