Operations | Monitoring | ITSM | DevOps | Cloud
Monitoring
The latest News and Information on Monitoring for Websites, Applications, APIs, Infrastructure, and other technologies.
7 Critical Considerations for Evaluating Infrastructure Monitoring Platforms
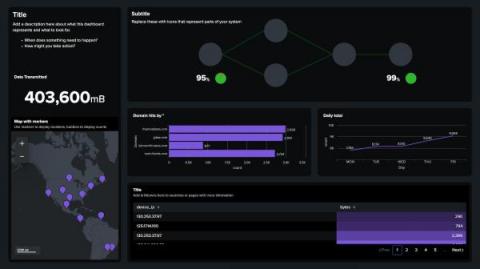
Dashboard Design: Getting Started With Best Practices (Part 1)
Every day, dashboards are viewed more than 500,000 times at Splunk. They’re what make the sea of data intelligible and help tell a story when working with a team. However, constant net-new dashboard creation is not necessarily a value-add activity — it’s a workflow to rapidly turn data into doing.
Database Monitoring 101: What Is It? Why Do You Need It?
Data is the foundation of the modern enterprise. Consequently, databases-in all their various forms and formats-are a critical component to the enterprise's IT ecosystem.
How Is Machine Learning Used In AIOps?
When we think of computers, we typically think in terms of exactness. For example, if we ask a computer to do a numeric calculation and it gives us a result, we are 100% sure that the result is correct. And if we write an algorithm and it gives an incorrect result, we know we have coded improperly and it needs to be corrected. This exactness however, is not the case when dealing with Machine Learning. As a matter of fact, it is par for the course, that Machine Learning will be incorrect a percentage of the time.
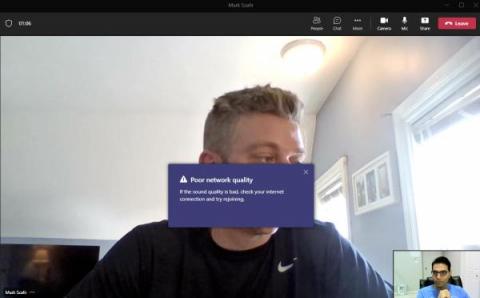
How to Get Real-Time Network Insight into Microsoft Teams Call Quality
A recent Exoprise customer survey found that 60-70% of application problems occur within the enterprise environment or home network/ISP. So, if you need to resolve Teams call quality problems, it's best to investigate your network before you try and finger point to Microsoft. In today's article, we see how this applies to Exoprise when team members work from home or in a hybrid work setting. Last Friday, at about 10:00 am EST, I jumped on an impromptu video call with one of my sales colleagues to discuss an ongoing marketing project. Although I am based in the Northern Virginia area, my comrade (as they say in British English!) is from Boston.
How to add a Golden Signal to a service in Gremlin RM
How to monitor Vault with Google Cloud Platform
Minimizing HTTP Requests to Improve Performance | Snack of the Week
August Monthly Product Update - InfluxDB Native Collectors, Improved Tasks, CLI Onboarding, and a New OSS Distribution
We love to write and ship code to help developers bring their ideas and projects to life. That’s why we’re constantly working on improving our product in sync with developer needs to ensure their happiness and accelerate Time To Awesome. This month is special. We have many features that we think you will love when onboarding or continuing to use InfluxDB. We launched Native Data Collectors this month.


