Operations | Monitoring | ITSM | DevOps | Cloud
Monitoring
The latest News and Information on Monitoring for Websites, Applications, APIs, Infrastructure, and other technologies.
Minimizing HTTP Requests to Improve Performance | Snack of the Week
August Monthly Product Update - InfluxDB Native Collectors, Improved Tasks, CLI Onboarding, and a New OSS Distribution
We love to write and ship code to help developers bring their ideas and projects to life. That’s why we’re constantly working on improving our product in sync with developer needs to ensure their happiness and accelerate Time To Awesome. This month is special. We have many features that we think you will love when onboarding or continuing to use InfluxDB. We launched Native Data Collectors this month.
Building a one-stop Open Source Observability Platform | OpenObservability Podcast
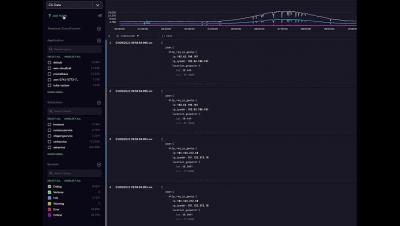
Archive Query 3 minute Overview
IDC Analyst Brief: Why You Need to Proactively Monitor and Optimize UC&C
Rich Costello, Senior Research Analyst at IDC has recently developed an Analyst Brief that looks at the growing need for proactive service quality management and optimization tools for communication and collaboration environments. As the world pivoted online during the COVID-19 pandemic, few companies were ready to support a fully virtual workforce that still required constant connection and to remain as productive as possible.
How to reduce MTTR with Grafana Loki and Grafana Tempo: Inside the Houzz observability renovation
Houzz is where millions of homeowners and home improvement professionals go to seek inspiration and supplies for their remodeling projects. But to continue as the leading platform for home remodeling and design, the Houzz tech stack needed a renovation of its own as the company scaled. In response, the Houzz team began by revamping their monoliths into microservices.
The Theme Park Workplace: A Modern Approach to IT Operations
IT teams in modern workplaces are no longer spending the bulk of their time troubleshooting and break/fixing issues. As in any service industry in the consumer world, IT service workers are now expected to deliver a great experience to their consumers – the employees. Managing the workplace has become much more like managing a theme park, where every aspect of its real estate should exhibit interest, joy, and fun; everything that makes up a great experience.
5 Best Practices of Network Security Monitoring
According to Accenture’s “State of Cybersecurity Resilience 2021” report, security attacks have increased 31% from 2021 to 2022. This statistic shows that organizations are not ready with a robust security plan and lack continuous network monitoring, resulting in security loopholes. Efficient network infrastructure is crucial for the success of your enterprise.
The Scaling Limitations of Graphite and Solutions to Overcome Them
Graphite is a free open-source software (FOSS) tool that monitors and graphs numeric time-series data. Graphite was originally a project developed internally at Orbitz in 2006, which eventually grew to be their foundational monitoring tool. In 2008, Orbitz allowed Graphite to be released under the open source Apache 2.0 license. Graphite made it possible to know more than simply if applications were up and running.


