Operations | Monitoring | ITSM | DevOps | Cloud
Monitoring
The latest News and Information on Monitoring for Websites, Applications, APIs, Infrastructure, and other technologies.
Announcing Sensu's Series A Financing
That new new. New software, new branding, new website, new financing, new board members, and new jobs. Oh my! I’m very pleased to announce that Sensu Inc has raised $10M in Series A financing led by Battery Ventures, with participation by seed-stage investor Foundry Group.
Discover and monitor the IBM ecosystem
Tips and metrics for application monitoring
Want to make sure your daily backups are running? Take a look at PushMon, the easiest way to monitor your cron and scheduled tasks.
Your Rails & Elixir performance metrics inside Chrome Dev Tools
Browser development tools - like Chrome Dev Tools - are vital for debugging client-side performance issues. However, server-side performance metrics have been outside the browser's reach. That changes with the Server Timing API. Supported by Chrome 65+, Firefox 59+, and more browsers, the Server Timing API defines a spec that enables a server to communicate performance metrics about the request-response cycle to the user agent.
Monday Update - Domain and SSL updates
Today we’ve made some changes to our Domain and SSL features to make your monitoring set ups more effective, and cover a wider range of use-cases.
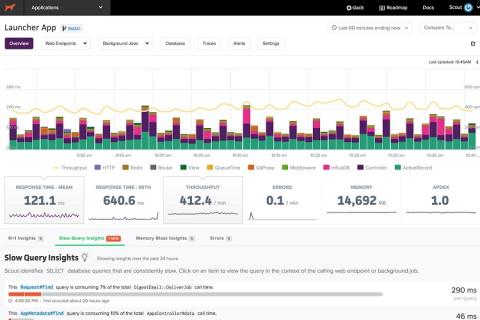
Under-the-hood with Scout: a look at a New Relic alternative
When New Relic launched ten years ago, web applications had a tendency to fail hard and in more obvious ways. Today, it's easier to build resilient apps, but they fail in more complex, unique, and subtle ways. These issues are time-consuming to track down. While several niche New Relic alternatives have appeared, they've focused on a lighter feature set versus solving these increasingly hard performance problems.
New feature in Applications Manager: SAP MaxDB performance monitoring
SAP MaxDB is robust and reliable technology that is an immanent component of various mySAP technologies including APO (live cache) and KM. Since databases like MaxDB store huge amounts of data, in-depth monitoring is vital for optimal operation of these systems.
Infrastructure maps: Build and visualize custom network topology maps to dissect network outages and performance bottlenecks in your IT stack
The ability to visualize your IT infrastructure from end to end is critical in fostering successful operations and delivery of service. Being a network admin, you need to keep a close eye on all your network devices, whether they're across the globe or inside your data centers. However, this is difficult to do without an actual location-based topology map of your network infrastructure.
Icinga Monthly Snap March: Icinga Camps, Roadmap & Releases
Icinga Camp Berlin and New York were a blast – thank you everyone for joining! The archive for both is now online including slides and recordings.


