Operations | Monitoring | ITSM | DevOps | Cloud

Monitoring

The latest News and Information on Monitoring for Websites, Applications, APIs, Infrastructure, and other technologies.

Feature: Custom Alert Times

Not all websites are the same. From personal blogs to business websites, online shops to community forums, SaaS applications to video streaming services, websites come in all shapes, sizes and flavours. It follows that not all websites have the same uptime requirements. If a personal blog goes down for 20 minutes it might not be a big problem, but the same downtime for a popular online shop could be a major concern.

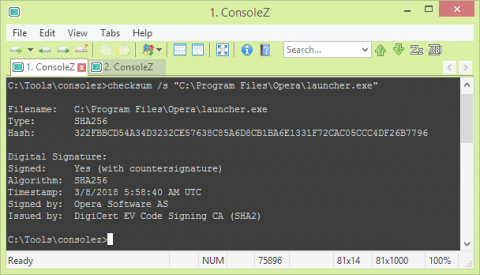
EventSentry SysAdmin Tools: Digital Signature Verification with checksum.exe

Windows supports a code-signing feature called Authenticode, which allows a software publisher to digitally sign executable files (e.g. .exe, .msi, …) so that users can verify their autenticity. The digital signature of a file can be viewed in the file properties in Windows explorer on the “Digital Signature” tab.

NiCE Extends Microsoft System Center Operations Manager by Monitoring Office 365 Synthetic Transactions for Hybrid Exchange

Leonberg, 14-03-2018 – NiCE IT Management Solutions GmbH, a key-player in the Enterprise Application Monitoring market with more than 25 years of experience in complementing the major IT Management Platforms like Microsoft System Center Operations Manager (OM) and Micro Focus Operations Manager has announced the availability of the NiCE Active O365 Management Pack, enabling advanced synthetic, hybrid Microsoft Exchange Online monitoring.

Development: Don't hack the libraries you use

This is one of those things they don’t teach you in school. These days, it’s not only time-consuming to build everything from scratch, but also not wise. These days, it’s all about rapid prototyping, continuous integration and “moving fast and breaking things”. There’s no point in implementing a time and date Javascript library, as moment.js already does that job wonderfully.

Gain deeper insight into your AWS environment with our new multi-monitor metric views

One of the biggest challenges in a self-provisioned, public cloud environment like Amazon Web Services (AWS) is finding the right balance between resources, performance, and cost. With no initial visibility into usage stats, AWS customers tend to overprovision compute, storage, and database resources to cushion sudden spikes in demand. If users could see resource usage, they'd be able to determine if the numbers provisioned are really in line with the application workload.

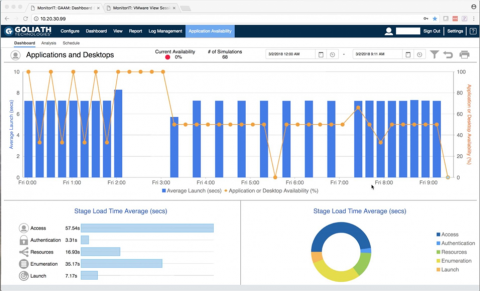
Independent Review: New Goliath Performance Monitor for VMware Horizon

Goliath Technologies has been a strong player in the Citrix ecosystem for quite a while now with multiple products such as their Performance Monitor, Application Monitor and Netscaler Monitor. The solutions already had support for VMware vSphere to monitor virtual machines and the physical infrastructure, and since the newest version, the Goliath Performance Monitor also supports VMware Horizon.

Visualize & Create Dashboards With Grafana In GroundWork Monitor

This webinar presented by GroundWork Open Source shows users how to gather and visualize data in a clear, flexible way using Grafana dashboards in GroundWork Monitor. We'll show you how to gather data from any source, including time series data. We'll also walk through how to set your own thresholds and alerts. Presented by GroundWork Open Source founder and vice-president of product strategy, Thomas Stocking.