Operations | Monitoring | ITSM | DevOps | Cloud
Monitoring
The latest News and Information on Monitoring for Websites, Applications, APIs, Infrastructure, and other technologies.
Grafana vs. Power BI
Grafana vs. Power BI – This is often a confusing decision for people wanting to select a data visualization and analytics tool with visually appealing and interactive insights. In this article, we highlight the features and benefits of both tools —Grafana and Power BI, bringing out their key differences to help you make a better decision. If you're interested in trying it out for yourself, sign up for our free trial.
10 Things to Consider before Multicasting Your Observability Data
This article was originally published in APM Digest here. Multicasting in this context refers to the process of directing data streams to two or more destinations. This might look like sending the same telemetry data to both an on-premises storage system and a cloud-based observability platform concurrently. The two principal benefits of this strategy are cost savings and service redundancy.
Is Cloud Infrastructure Right For You?
The Cloud infrastructure solution has been around for many years now and has been proven that it can optimize your operations, reduce costs, and boost the efficiencies of developers. Thanks to these benefits, organizations of all sizes in different industries are considering moving into the Cloud infrastructure if they haven’t. This article will explore the world of cloud infrastructure, helping you determine if it is the right fit for your organization.
Paving the way for modern search workflows and generative AI apps
Elastic’s innovative investments to support an open ecosystem and a simpler developer experience In this blog, we want to share the investments that Elastic® is making to simplify your experience as you build AI applications. We know that developers have to stay nimble in today’s fast-evolving AI environment. Yet, common challenges make building generative AI applications needlessly rigid and complicated. To name just a few.
What is Cardinality? Cardinality Metrics for Monitoring and Observability
Metrics to Monitor for AWS (ELB) Elastic Load Balancing
Syslog-NG: The Sandbox That Taught Me to Appreciate Cribl Even More
Recently, we launched a new Sandbox focused on handling syslog at scale with Cribl. The marketing messaging behind the Sandbox has been done a couple times already; therefore I wanted to let y’all see what we as Cribl Technical Marketing Engineers(TMEs) actually do in our daily lives. I’ll try to keep it engaging, with tales of danger and subterfuge, but I can only take so much artistic license. What’s in a Sandbox and how the Sandbox platform functions (i.e.
First User Panel discussion! | Netdata Office Hours #10
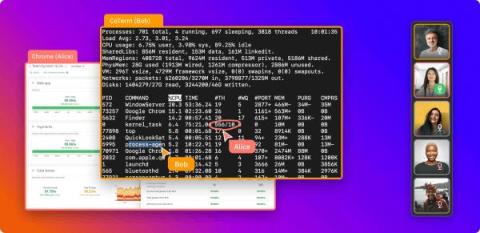
Introducing CoTerm, your collaborative terminal for pair programming and debugging
For too long, engineers have had to piece together an unwieldy combination of tools to collaboratively debug and resolve incidents while pair programming in real time. These activities normally require developers to work individually through a terminal, but the patchwork solutions that allow teams to work together in terminals all have significant drawbacks.


