Operations | Monitoring | ITSM | DevOps | Cloud

Monitoring

The latest News and Information on Monitoring for Websites, Applications, APIs, Infrastructure, and other technologies.

The future of generative AI in public sector

Recently, I sat down with Adelaide O’Brien, research vice president at IDC Government Insights, to discuss the current and future state of generative AI in the public sector worldwide. The full conversation is available to view on demand, but I also wanted to highlight some of the takeaways from the discussion.

Spring Boot Monitoring with Open-Source Tools

Spring Boot Monitoring aims to provide real-time insights into various aspects of a Spring Boot application. Spring Boot provides useful libraries like the Spring Boot Actuator and Micrometer to aid in monitoring. But in order to set up effective monitoring, you need to use a tool where you can send the monitoring data for storage and visualization. In this tutorial, we cover: In this tutorial, you will learn how to monitor a Spring Boot application with SigNoz and OpenTelemetry.

7 Million Docker Downloads, uPlot Charting Library, and Improvements in Dashboard - SigNal 31

Welcome to the 31st edition of our monthly product newsletter - SigNal 31! We shipped a lot of improvements in our dashboard user experience and crossed 7 million Docker downloads. Let’s see what the humans of SigNoz did in the month of November 2023.

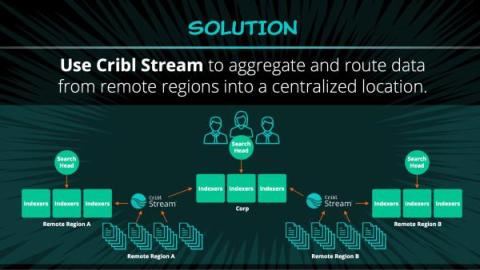
Routing Around the World with Cribl Stream!

Transunion is an American consumer credit reporting agency that operates in over 30 countries. They use Cribl Stream to aggregate and route regional data into a centralized hub, presenting it in a single dashboard that admins can use to interpret the overall health of their system. Watch the full video on YouTube or below to see Transunion’s Steve Koelpin and Don Reilly walk through this use case.

Nginx Metrics and Logs Monitoring with OpenTelemetry

Nginx metrics and logs monitoring are important to ensure that Nginx is performing as expected and to identify and resolve problems quickly. In this tutorial, you will install OpenTelemetry Collector to collect Nginx metrics and logs and then send the collected data to SigNoz for monitoring and visualization. In this tutorial, we cover: If you want to jump straight into implementation, start with this pre-requisites section.

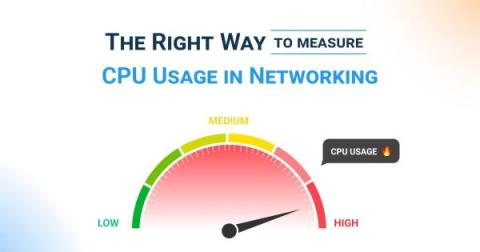
How to Measure CPU Usage in Networking

Whether you're troubleshooting performance issues or aiming for proactive management, measuring CPU usage is a key skill for network administrators. In the world of networking, CPU usage serves as a vital indicator of system health, resource allocation, and potential bottlenecks. In this comprehensive guide, we delve into the intricacies of measuring CPU usage in networking.

Detecting Dubious Domains with Levenshtein, Shannon & URL Toolbox

In Parsing Domains with URL Toolbox, we detailed how you can pass a fully qualified domain name or URL to URL Toolbox and receive a nicely parsed set of fields that includes the query string, top level domain, subdomains, and more. In this article, we are going to do some nerdy analytic arithmetic on those fields.

Cassandra vs OpenSearch

In the following comparison table, we will provide you with an extensive guide designed to enable a detailed assessment of Cassandra and OpenSearch. This comparison aims to supply an in-depth exploration of multiple aspects of these two database systems, providing you with the insights required to make informed decisions tailored to your specific use case.