Operations | Monitoring | ITSM | DevOps | Cloud

Monitoring

The latest News and Information on Monitoring for Websites, Applications, APIs, Infrastructure, and other technologies.

A deep dive into CPU requests and limits in Kubernetes

In a previous blog post, we explained how containers’ CPU and memory requests can affect how they are scheduled. We also introduced some of the effects CPU and memory limits can have on applications, assuming that CPU limits were enforced by the Completely Fair Scheduler (CFS) quota. In this post, we are going to dive a bit deeper into CPU and share some general recommendations for specifying CPU requests and limits.

OpenTelemetry vs Jaeger : Comparing Apple and Oranges

Open telemetry works with all the three signals i.e. it help in generating all the three signals while Jaeger only focuses on one signal (traces). The second key difference is Jaeger doesn't worry about generating data. It's more focused on the UI visualization long term storage of traces data while OpenTelemetry primarily focused on generating traces data.

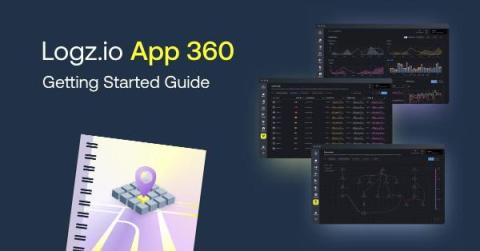
Application Observability in Minutes: How to Implement App 360

As applications in the cloud become more distributed and complex, the Mean Time To Resolution (MTTR) for production issues is getting longer. Modern systems are built with hundreds of distinct, ephemeral, and interconnected cloud components, which can make it exceptionally hard for engineers to understand the current state of their applications, what problems are impacting customers, and why those problems are occurring.

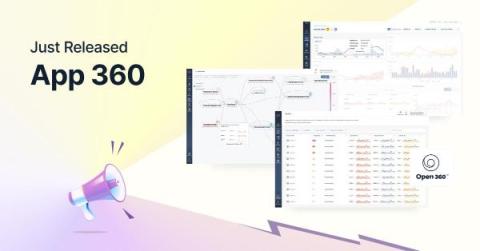
Introducing App 360: Your Observability-Centric, Cost-Effective APM Alternative

Years before founding Logz.io, I was a software engineer, working with various tools to ensure my products and services performed correctly. There were few tools I dreaded using more than application performance management (APM), and I know that I’m not alone. I hated traditional APM. It’s heavy. It’s hard to implement. It’s expensive. It takes a very long time to derive business value.

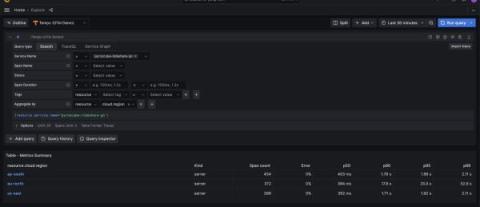
Traces to metrics: Ad hoc RED metrics in Grafana Tempo with 'Aggregate by'

In observability, finding the root cause of a problem is sometimes likened to finding a needle in a haystack. Considering that the problem might be visible in only a tiny fraction of millions or billions of individual traces, the task of reviewing enough traces to find the right one is daunting and often ends in failure.

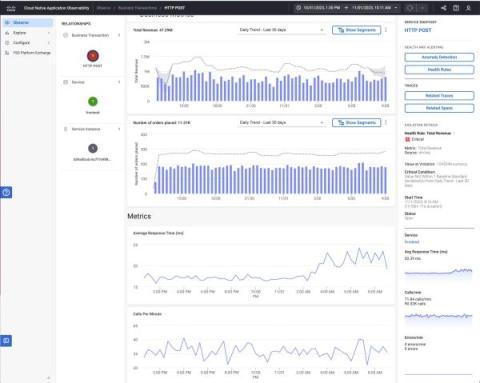
Transforming digital success: Cisco Cloud Observability business metrics unveiled

In the dynamic landscape of digital business, the pursuit of delivering exceptional user experiences in every digital interaction continues to be a challenge. Cisco, a pioneer in full-stack observability, announced on November 28 at AWS re:Invent the release of business metrics for Cisco Cloud Observability. Let’s delve into the revolutionary landscape that this innovation is carving for both business owners and technical users.

Learning by Example with Cribl's New Lookup Examples Pack

In the world of data management, Cribl offers various methods to enhance data using the Lookup Function and many C.Lookup Expressions. While Cribl’s documentation is comprehensive, practical examples are often the most effective learning tools. That’s why we’ve introduced the new Lookup Examples Pack.

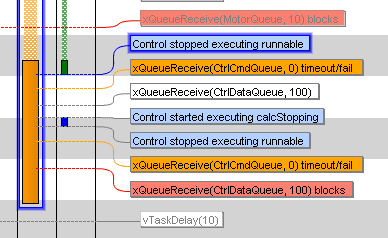
How To Use AUTOSAR Runnables With Tracealyzer

Tracing of “runnables” is a fairly new feature in Percepio Tracealyzer, added in v4.7.0. One of our automotive customers needed this feature to make ISO 26262 certification of their Electronic Control Unit (ECU) software easier. In order to properly allocate ECU functions to tasks and to cores, and to ensure that they meet the budgeted resources, it is useful to know execution times, response times and wait times for each task and runnable.

Is your Java Observability tool Lambda Expressions aware?

Most SREs and IT Ops manage Java applications without source code access or communication with AppDev teams. When applications have performance issues those SREs or IT Ops teams deploying and maintaining the infrastructure often have to prove that it is the application at fault and supply information to the app supplier which provides evidence of the issue.