

|
By Brian Conn
Today’s end users have little to no patience for performance issues. Jitters, slow load times, and full-blown outages can quickly lead to brand damage, lost customers, and diminished revenue. That’s why it’s essential for DevOps and engineers to be able to quickly identify and resolve issues before users ever notice them. Doing this requires collecting and analyzing massive amounts of telemetry data – metrics, traces, and logs.

|
By Will Krause
This article was originally published in APM Digest here. Multicasting in this context refers to the process of directing data streams to two or more destinations. This might look like sending the same telemetry data to both an on-premises storage system and a cloud-based observability platform concurrently. The two principal benefits of this strategy are cost savings and service redundancy.

|
By Will Krause
Dynamic observability is the concept that the amount of data collected should scale based on signals from your environment. Elastic infrastructure is not a new concept. Much of the internet is powered by services that provision more resources based on signals derived from metrics like cpu load, memory utilization and queue depth. If we can use tools to right size our infrastructure, why can’t we also use tools to right size the amount of data we collect?

|
By Will Krause
A truism amongst operations professionals is that any alert your observability platform produces should be actionable, otherwise it is just noise. Auto-remediation is a hard problem, so the most common action triggered by an alert is for an engineer to gather more data and context.

|
By Joshua Johnson
Observability has become one of the largest line items in the IT budget, second only to cloud costs. A main reason for this is teams are often stuck collecting significantly more data than they need. This is where Circonus Passport helps. Rather than filter data after it’s collected like current observability data pipeline management tools, Passport is used to filter data before it’s collected.

|
By Bob Moul
Sky-high observability costs or visibility gaps? This is the unfortunate trade-off many organizations have to make when it comes to determining how much telemetry data they should collect and send to their observability tools. Teams either collect more data than they need and pay the price, or they collect less and suffer visibility gaps. Today, this all changes.

|
By Brian Conn
In the dynamic world of IT, the way we monitor systems has seen a remarkable evolution. Gone are the days when monitoring was limited to basic server checks or infrastructure health. With the rise of cloud-native applications, serverless architectures, and container orchestration platforms like Kubernetes, the digital landscape has become a multi-dimensional maze.

|
By Will Krause
One of the hardest challenges in computer science is deciding what to name things. Adoption of consistent nomenclature is difficult because there is no one right answer. In fact, it’s not uncommon for different teams within organizations to choose different names for the same technologies. In the world of monitoring and observability, this can create quite a lot of confusion – not to mention wasted resources.

|
By Heather Miller
We’re excited to announce that we just released the next-generation of our observability platform – the Circonus Telemetry Cloud™. Here’s a closer look at what it is and why we think it’s a standout in the monitoring and observability space.

|
By Andy Hoffman
Domain Driven Design (DDD) is usually associated with microservice architectures. As microservice architectures have been perceived as burdensome and overly complex, so too have organizations started to call into question the relevance of DDD initiatives. The argument is usually that unless an organization reaches a mega-scale that requires eventing to keep and micro-services to scale horizontally, such architectures are overkill.

|
By Circonus
Learn about Passport, the industry's first dynamic telemetry management solution. Passport significantly eases telemetry agent management, allowing you to adapt your data collection based on environmental signals. High CPU? Start collecting data at 10s granularity vs 60s. Collect more data when you need it, less when you don't to gain better visibility, speed MTTR, and reduce observability costs.


|
By Circonus
Creating Time Bounded Rules for Configurations so a configuration file will be applied during a specified period of time.


|
By Circonus
Unlock the full value of your Kubernetes deployment with greater visibility into the health and performance of your clusters. Try the free edition of the Circonus Kubernetes monitoring solution, which allows you to monitor up to 10 nodes of 20 pods each at zero cost.
|
By Circonus
Understand the behavior of your systems with the Circonus monitoring and analytics platform, powered by histograms.
|
By Circonus
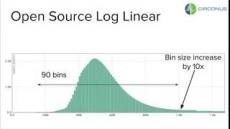
In this talk, we take a look at both log-linear and cumulative histograms and how they provide advantages over storing data as quantiles, averages, and other histogram implementations, such as linear and fixed-bucket.

|
By Circonus
Machine Data Intelligence enables what was previously impossible due to technology limitations. Now, enterprises have unprecedented access to business insights that are driving transformative results.
|
By Circonus
As the number of things we want to monitor grows and sensors proliferate our world, enterprises have the opportunity to gather and analyze vast amounts of machine-generated data that provide extraordinary business insights.
|
By Circonus
Current monitoring systems weren't built for the new requirements of IT. How can you be sure that yours is?
|
By Circonus
The key to improving your service quality could lie in accurately measuring the metrics associated with your microservices.
- December 2023 (1)
- November 2023 (2)
- October 2023 (2)
- September 2023 (8)
- August 2023 (2)
- July 2023 (2)
- June 2023 (1)
- May 2023 (2)
- April 2023 (1)
- March 2023 (1)
- February 2023 (1)
- January 2023 (1)
- November 2022 (3)
- October 2022 (1)
- September 2022 (1)
- July 2022 (1)
- June 2022 (2)
- May 2022 (2)
- April 2022 (1)
- March 2022 (2)
- February 2022 (2)
- November 2021 (1)
- October 2021 (1)
- September 2021 (2)
- August 2021 (4)
- July 2021 (2)
- June 2021 (1)
- May 2021 (5)
- April 2021 (3)
- March 2021 (5)
- February 2021 (2)
- January 2021 (3)
- December 2020 (3)
- November 2020 (1)
- September 2020 (1)
- August 2020 (2)
- July 2020 (4)
- June 2020 (3)
- May 2020 (3)
- April 2020 (3)
- March 2020 (5)
- January 2020 (2)
- December 2019 (2)
- November 2019 (3)
- October 2019 (1)
- August 2019 (1)
- May 2019 (1)
- April 2019 (3)
- February 2019 (1)
- January 2019 (1)
- December 2018 (1)
- November 2018 (4)
- September 2018 (3)
- August 2018 (1)
- July 2018 (3)
- June 2018 (1)
- May 2018 (5)
- April 2018 (6)
- March 2018 (1)
- January 2018 (1)
- September 2017 (1)
- April 2017 (1)
Machine Data Intelligence for the most demanding use cases. Collect, store, manage, and analyze IoT and IT Infrastructure data at unprecedented volume and frequency. Circonus' high performance machine data intelligence platform outperforms other IoT and IT infrastructure solutions in its ability to handle real-time fault detection, anomaly detection, and predictive analytics at unprecedented scale. With the Circonus Platform, companies can optimize operations, gain valuable insights, and deliver exceptional user experiences with total confidence that they are getting accurate, real-time information.