Operations | Monitoring | ITSM | DevOps | Cloud
Monitoring
The latest News and Information on Monitoring for Websites, Applications, APIs, Infrastructure, and other technologies.
How to Monitor Apache Server Metrics with OpenTelemetry
Optimize Monitoring with Time-based Threshold Profiles
Large Enterprise Cuts Elasticsearch and SIEM Costs by 40% with Observo.ai
RISE with SAP FAQ - update
My last thoughts on this blog were published some two and a half years ago, and the topic of RISE with SAP and where it best fits has evolved over time. By now, SAP RISE is familiar to the SAP marketplace and has become more understood and recognized – though how SAP markets the solution leaves some subtle and important details unclear.
Top tips: Four compelling use cases for AI in FinTech
Top tips is a weekly column where we highlight what’s trending in the tech world today and list out ways to explore these trends. This week, we’re examining four use cases for AI in the ever-growing FinTech sector. The FinTech sector has transformed the discussion around the financial services industry from top to bottom.
Grafana Dashboard Tutorial: How to Get Started
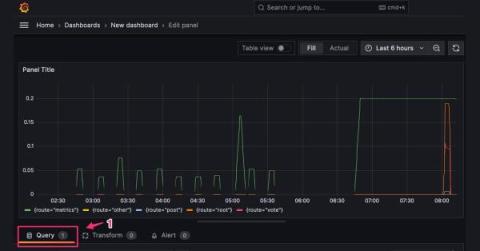
Grafana is an open-source web application for visualizing data. You can query your data, create visuals, and receive alerts to better understand what you have. Some people think of Grafana as a Kubernetes-only tool, but in reality, it’s simply a data visualization tool that became popular within the Kubernetes ecosystem, especially when combined with Prometheus. In this post, I’ll focus on a very specific part of Grafana: the dashboards.
Observability - Insurance vs Growth driver?
Functions, power up your troubleshooting toolkit! | Netdata Office Hours #9
Best Practices for Monitoring Network Usage & Maximizing Performance
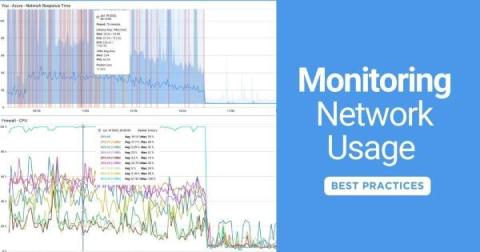
As organizations continue to expand their digital footprint, the demand for a robust and efficient network infrastructure has surged. To navigate the complexities of today's networks, IT professionals must not only be vigilant in monitoring network usage but also adept at implementing best practices to ensure peak performance.


