#GetToKnowMTLO: How Martello is Solving the Modern Workplace Challenge
What's the modern workplace challenge, and how is Martello solving it? See what's got Microsoft customers and partners excited!


The latest News and Information on Monitoring for Websites, Applications, APIs, Infrastructure, and other technologies.
It has been seven years since Rent the Runway posted their engineering ladder, kicking off a veritable trend of engineering teams open sourcing their ladders. Interestingly, nearly all of them seem to have coalesced around “area of scope” as a useful proxy for level. At first glance, “area of scope” does seem to make sense. Senior engineers should be able to work across larger areas of the organization. In addition, your area of influence should expand as you gain experience.
Kubecon EU returned to Spain. This time to Valencia, city of paella and horchata and, of course, a great place for big events. We had a great time meeting you all in person, and attending the talks. Here are our hot takes from the event. The main event started on Wednesday, but before that different co-located events took place: Ebpf Day, Cloud Native SecurityCon, and PrometheusDay among others. These events gathered a large number of attendees.
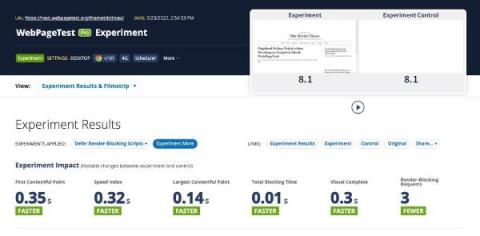
As many of you will know, Catchpoint and WebPageTest joined forces 18 months ago with the goal of building stronger alignment across the IT org to ensure performance issues can be caught in QA, staging and development, not just once new features are released to production.
PCI? PCI SSC? PCI DSS 4.0? Need these acronyms explained? Well, this blog is for you. Read on to find out how the new PCI DSS 4.0 (a set of security standards created to ensure companies maintain a secure financial environment) will affect how you transact online, monitor your website payment gateways and more.
While 2020 and 2021 were significant years for us, we’ve entered this year ready to give more to our users! We’re delighted to share we have raised $142 million in a Series D funding round! So what does that mean for you exactly? Over the past few months, our team has been working hard to build custom mapping for metrics, an advanced tracing UI, and more into our platform. The world is our oyster, and we can’t wait for you to see what else we have planned!
No, it is not! How can it possibly be dead? In my opinion, monitoring is some thing very important for building a successful IT infrastructure. If monitoring is dead for an IT infrastructure then either that infrastructure already does not exist; or it is so powerful that problems like failure, errors, utilisation issues etc never occurs in the IT infrastructure which is literally not possible.