Operations | Monitoring | ITSM | DevOps | Cloud
Monitoring
The latest News and Information on Monitoring for Websites, Applications, APIs, Infrastructure, and other technologies.
An (only slightly technical) introduction to Loki, the Prometheus-inspired open source logging system
Every application creates logs. Web servers, firewalls, services on your Kubernetes clusters, public cloud services, and more. For companies, being able to collect and analyze these logs is crucial. And the growing popularity of microservices, IoT, cybersecurity, and cloud has brought an explosion of new types of log data. That’s why log management is a huge $2-billion-plus market that’s growing 14% YoY.
Morgan NPM Logger - The Beginner's Guide
In this guide, we’ll cover how you can use Morgan npm to log requests and other aspects of your web application built on Express (or any of the similarly architected frameworks around). So what can Morgan do for you? And when would you need it? As you’ll see in a second if you’re working with Express or a similar framework (such as restify) you’ll have the need to log incoming information about the requests, this framework was designed specifically for that, just keep reading.
Alert with Precision and Context using Sentry + PagerDuty
Work From Home Solution: Office 365
Getting started with Grafana Loki on Google Kubernetes Engine - under 5 minutes.
Unpacking Events: All the Better to Observe
At Honeycomb, we’ve been listening to your feedback. You want easier ways to predict usage and scale your observability spend with your business. What would it look like to meet you where you already are, using similar terms, and give you more control with a simpler experience? We think that means reimagining the customer experience into one that centers around an event-based model. But what exactly is an event? What does that mean for your team’s observability journey?
Free AIOps and Remote Access with OpsRamp's Infrastructure Discovery & Monitoring
We realize that many companies are facing tighter technology budgets right now, yet at the same time IT needs are unrelenting. From supporting remote workforce continuity and productivity to partnering with business leaders on redesigning products and services during the Covid-19 pandemic, IT organizations have some pretty heavy mandates right now.
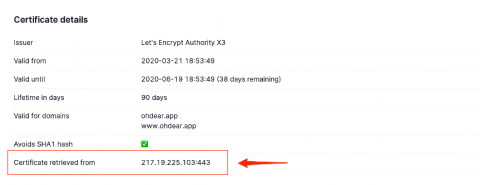
How Oh Dear identified a certificate problem at a large CDN provider
As part of our service, we perform SSL certificate monitoring. We do this slightly different than other providers, which is why were able to detect a problem with the SSL certificates of a large, commercial, CDN provider. In this post, we'll do a technical deep-dive into how we found this problem!
How LineMetrics Uses InfluxDB to Launch Its IoT Monitoring Platform
“What would it be like to have an asset monitoring solution that can be installed within minutes and is independent of all existing IT systems, without endangering existing processes?” LineMetrics was founded in 2012 in Haag, Austria, in response to questions just like this one. LineMetrics developed a complete real-time asset monitoring solution delivered through its end-to-end Internet of Things (IoT) platform.


