Operations | Monitoring | ITSM | DevOps | Cloud
Monitoring
The latest News and Information on Monitoring for Websites, Applications, APIs, Infrastructure, and other technologies.
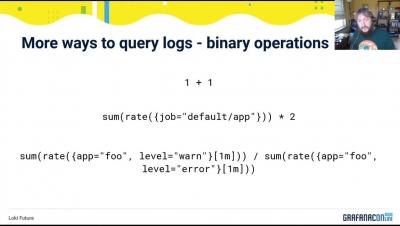
GrafanaCONline: Loki future
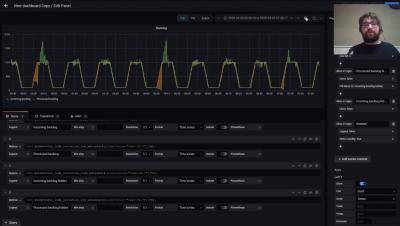
GrafanaCONline: Powerful graph representations in Grafana
Kubernetes performance monitoring
Kubernetes is an open source-system for managing containerized applications across multiple hosts. It aims to provide a “platform for automating deployment, scaling, and operations of application containers across clusters of hosts.” Originally developed by Google, it is now maintained by the Cloud Native Computing Foundation (CNCF).
GrafanaCONline Day 6 recap: The power of Tanka, and a peek into the world of beehive monitoring with Grafana dashboards
GrafanaCONline is live! We hope you’re able to catch the great online sessions we have planned. If you aren’t up-to-date on the presentations, here’s what you missed on day 6 of the conference.
Cortex v1.1 released with improved reliability and performance
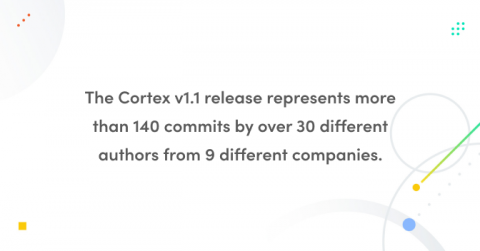
Today we’re releasing Cortex 1.1, the first (minor) release since Cortex went GA in March, over 6 weeks ago. This release represents more than 140 commits by over 30 different authors from 9 different companies. In this post we’re going to give you some of the highlights of this release.
What Is the Difference Between SaaS-Based and Cloud-Based?
Software as a Service (SaaS) based and cloud-based products and services may sound like they’re referring to the same thing. True, if the service exists “in the Cloud,” it may be both SaaS and cloud-based. While your SaaS-based application will almost certainly be cloud-based as well, your cloud-based services may not always be SaaS-based. SaaS is a component of cloud computing.
GrafanaCONline Day 5 recap: Using Grafana, Cortex and Loki to monitor an electric car battery, and creating a desktop Kubernetes cluster
GrafanaCONline is live! We hope you’re able to catch the great online sessions we have planned. If you aren’t up-to-date on the presentations, here’s what you missed on day 5 of the conference.
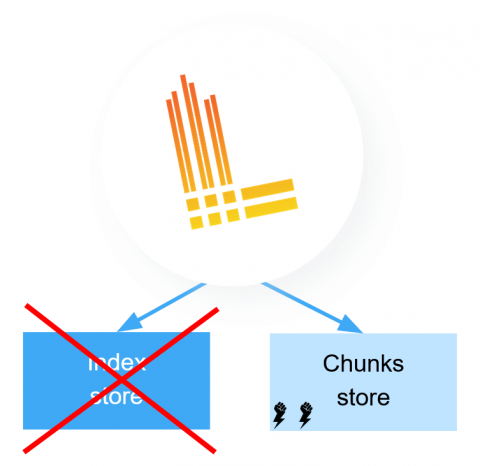
Loki v1.5.0 released, with no more dependency on a separate index store
Today we released version 1.5.0 of Loki! This release comes with some really exciting news and a little bit of caution if you operate Loki installations.
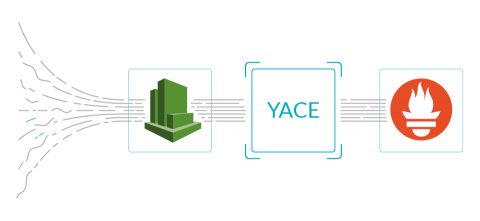
Improving the Prometheus exporter for Amazon CloudWatch
A Prometheus CloudWatch exporter is a key element for anyone wanting to monitor AWS CloudWatch. Exporting CloudWatch metrics to a Prometheus server allows leveraging of the power of PromQL queries, integrating AWS metrics with those from other applications or cloud providers, and creating advanced dashboards for digging down into problems. But, who watches the watcher? Despite those advantages, using the wrong exporter or an incorrect configuration can have bad consequences in production environments.


