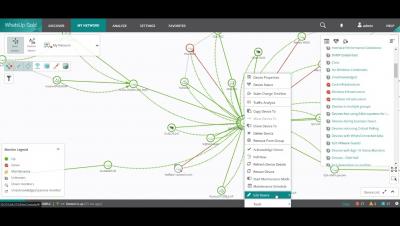
Get to know the Azure Plugin (Event Hubs)
Prerequisites, configuration in Azure and operation of the Event hubs plugin are shown.


The latest News and Information on Monitoring for Websites, Applications, APIs, Infrastructure, and other technologies.
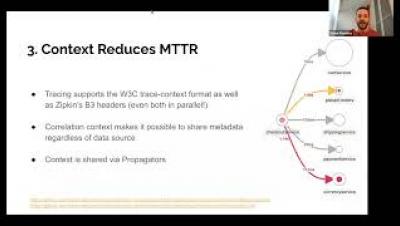
Application performance monitoring (APM) is a process of monitoring and analyzing performance issues within an application. In monolithic architecture, monitoring the performance of an application using APM tools was straightforward. However, once the application adopts microservice architecture, the application becomes more complex, and the business functionalities flow into different microservices to complete the workflow.
As part of the Grafana 9.2 release, we’re making it easier to create dynamic and interactive dashboards with a new and improved Grafana Loki query variable editor. Templating is a great option if you don’t want to deal with hard-coding certain elements in your queries, like the names of specific servers or applications. Previously, you had to remember and enter specific syntax in order to run queries on label names or values.
It’s that time of year again! If you’re not a procrastinator, you’ve probably already blown out your sprinklers for winter and are looking forward to the snow and holidays ahead. Well done, irrigation purists! I, on the other hand, am an olympic-level procrastinator and will usually wait until the last moment before NWS forecasts a 10″ snow for the night then frantically search for my air compressor.
Datadog Real User Monitoring (RUM) provides end-to-end visibility into the user experience and performance of your browser and mobile applications. RUM allows you to capture and retain complete user sessions for 30 days. This means you can pinpoint bugs, prioritize issues, and determine fixes with data collected across an entire quarter.
I’ve had the honor and privilege of authoring The SRE Report for the last three years. For the 2023 version, this included working with some amazing individuals like Anna Jones, Kurt Andersen, and Steve McGhee. Download The SRE Report 2023 here (no registration required).