Monitor gce instances with prometheus and ops agent
Google Cloud Ops Agent now supports monitoring GCE instances with Prometheus.


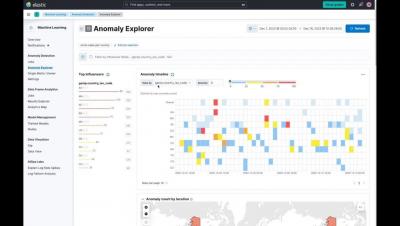
The latest News and Information on Monitoring for Websites, Applications, APIs, Infrastructure, and other technologies.
Google Cloud Ops Agent now supports monitoring GCE instances with Prometheus.
In this article, learn how to setup application monitoring for Golang apps using an open-source solution, SigNoz. If you want to check our Github repo before diving in 👇 Scalability, Reliability, Maintainability... The list goes on for the benefits of microservices architecture in today's world. But along with these benefits also comes the challenges of complexity.
Integration is a fundamental part of any IT infrastructure. It allows organizations to connect different systems and applications together in order to share data and information. As organizations become more complex and interconnected, they need to ensure they have complete observability and monitoring of their integration architecture. This is essential in order to discover, understand and fix any issues that can arise.
Stack traces show us exactly where an exception occurred, but you can still be left wondering: What arguments or state caused the exception to occur? If you can reproduce the issue locally with a debugger attached you’ll have access to these local variables, but with Sentry you can identify the exception location without needing to reproduce the issue locally. By including local variables with stack traces, Sentry events become much closer to the full debugging experience.
Having user-friendly programs is paramount for any software company’s success. To gain a better understanding of your users’ experience and enjoyment, it’s vital that you learn how customers interact with your app or website. Real user monitoring (RUM) solutions enable your company to visualize how users interact with your software, helping you learn what works best for your customers so you can thrive against the competition.
Some things are inevitable, like Thanos, paying taxes, and change. While it would be nice to simply snap our fingers and deliver new products, things aren’t so simple in the real world. InfluxDB has been the leading time series database since January 2016. But we’re not content to rest on our laurels. The quest to improve InfluxDB is constant and ongoing. As of today, we’re beginning the rollout of an all-new and improved InfluxDB Cloud powered by IOx.
Back in October 2022, our Founder and CTO Paul Dix announced the limited release of InfluxDB IOx, our new database engine. After several months of beta testing, we’re excited to announce the next phase of our database engine: general availability. As of today, InfluxDB IOx releases to the rest of the world as the new and improved InfluxDB Cloud.