Operations | Monitoring | ITSM | DevOps | Cloud

Monitoring

The latest News and Information on Monitoring for Websites, Applications, APIs, Infrastructure, and other technologies.

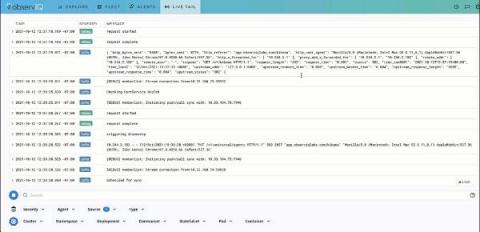
Troubleshooting Pod issues in Kubernetes with Live Tail

With the advent of IaaS (Infrastructure as a service) and IaC (Infrastructure as Code), it is now possible to manage versioning, code reviews, and CI/CD pipelines at the infrastructure level through resource provisioning and on-demand service routing. Kubernetes is the indisputable choice for container orchestration.

How Time Series Databases Work-and Where They Don't

In my previous post, we explored why Honeycomb is implemented as a distributed column store. Just as interesting to consider, though, is why Honeycomb is not implemented in other ways. So in this post, we’re going to dive into the topic of time series databases (TSDBs) and why Honeycomb couldn’t be limited to a TSDB implementation. If you’ve used a traditional metrics dashboard, you’ve used a time series database.

6 All Too Common Network Security Hacks Your Team Should Know About

As an IT pro, you’re probably used to doing the heavy lifting when it comes to network security. You might even find your team responsible for educating the rest of your company on best practices when it comes to network common security hacks and how to prevent them. Today, we’re here to lighten that load a little.

AIOps Summit Recap: Why Observability is Key, and How to Get There

“It’s not rocket science.” In the past, we’ve all heard that statement made. Quite often, it’s applicable. It’s true we can overthink or unnecessarily overcomplicate matters. Don’t tell that to someone who’s responsible for network performance and continuity today, however.

Webinar - Beyond Selenium, Synthetic Monitoring for the 2020s

Monitoring the Impossible What if a solution could look for user interface elements based on their appearance and interact with them via mouse and keyboard events, just like a person? Understand the challenges and limitations of Selenium and how you can overcome them with 2 Steps technology in this webinar. The first instalment in the Monitoring the Impossible Webinar series was brought to you by 2 Steps.

Don't let Prometheus Steal your Fire

Prometheus is an open-source, metrics-based event monitoring and alerting solution for cloud applications. It is used by nearly 800 cloud-native organizations including Uber, Slack, Robinhood, and more. By scraping real-time metrics from various endpoints, Prometheus allows easy observation of a system’s state in addition to observation of hardware and software metrics such as memory usage, network usage and software-specific defined metrics (ex.

Monitoring as a service, here we come!

On the way to perfecting its services, Pandora FMS launches one of the most advanced and complete solutions in its history as monitoring software: Monitoring as a Service (MaaS). As we all know by now, Pandora FMS is a software for network monitoring that, among many other possibilities, allows visually monitoring the status and performance of several parameters from different operating systems (servers, applications, hardware systems, firewalls, proxies, databases, web servers, routers…).

Should you care about AIOps? Obviously.

There's a lot of hype in the marketplace about AIOps right now, and there's a lot of people who've got some interesting ideas about what it should be. The most common idea that I hear is that it's essentially a layer of AI magic that sits across everything that you've got in your IT tooling today and then make sense of all of that for you and then we'll decrease the number of incidents you have and reduce your MTTR...