Operations | Monitoring | ITSM | DevOps | Cloud

The latest News and Information on Monitoring for Websites, Applications, APIs, Infrastructure, and other technologies.

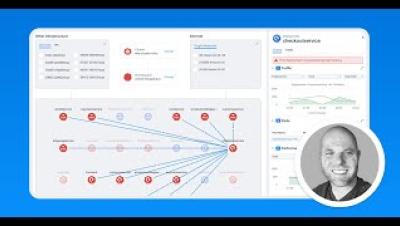
Level 1 NOC WiFi/LAN/WAN Correlation and Triage

The latest release of Network Management 23.3 from Broadcom, the solution extends assurance to cloud-based Wi-Fi architectures with global correlation to your LAN and WAN infrastructure for a complete view of network health across vendors, protocols and user experiences. Today, most NOCs still monitor Wi-Fi as if it is a wired service with no comprehension of its radio integrity or user movements. As a continuation of the "Unified NetOps" capability, v23.3 will enable any NOC to monitor wireless networks using the standard workflows for alarm management, ticketing, and triage, but with the added Level 2 NOC awareness of radio frequency metrics, noise level, interference, and wireless user demographics and movements.

Elastic Observability ES|QL Demo

Elevate Your Data Game with Elastic Observability and ES|QL! Discover the future of data querying with Elastic’s groundbreaking new feature: ES|QL! In this video you'll deep dive into how ES|QL revolutionizes the way you interact with complex, distributed data, ensuring seamless and efficient data analysis. Who Is This For? Whether you are a data analyst eager to optimize your query writing skills, or a business leader looking to democratize data insights across your organization, this video is tailor-made for you!

Troubleshooting Kubernetes Network Performance Issues with Kentik Kube

Discover the power of Kentik Kube, the solution for unparalleled network insight into Kubernetes workloads. In this video, Phil Gervasi walks us through Kentik Kube’s ability to track and visualize container traffic across data centers, public clouds, and the internet. Using the interactive Kube map, Phil demonstrates how to troubleshoot a network latency issue affecting an online shopping application, highlighting the tool's capacity for in-depth analysis of pod performance and node-to-node traffic. Learn how to create custom dashboards for custom oversight, set up proactive alerts for performance issues, and enforce security and compliance across your Kubernetes infrastructure.

Elasticsearch and LangChain collaborate on production-ready RAG templates

For the past few months, we’ve been working closely with the LangChain team as they made progress on launching LangServe and LangChain Templates! LangChain Templates is a set of reference architectures to build production-ready generative AI applications. You can read more about the launch here.

Why public sector needs AI-powered observability: Cost savings, ROI, and analyst efficiency

Elastic Observability customers saw 243% ROI and $1.2 million in savings over 3 years For government and education organizations around the world, facilitating an efficient, reliable customer experience is essential when providing critical services and building trust with stakeholders. As technology infrastructure expands and the IT landscape becomes a complex mix of private cloud, public cloud, and air-gapped environments, the ability to see across all systems and data is challenging yet critical.

Troubleshooting Azure Virtual Desktop (AVD) Issues through Logon and Beyond

Today, I’ll be covering troubleshooting Azure Virtual Desktop (AVD) issues. I’ll cover the common causes of problems beyond logon and how you can monitor and troubleshoot to identify the root-causes of issues and how to resolve them resolve them. For information on troubleshooting logon problems and slow logons, please see my previous article: Troubleshoot Slow Azure Virtual Desktop (AVD) Logons.

Setting up better logging in Azure Functions

We have been using Azure Functions for years. Being able to easily deploy and run code on both Azure App Services and real serverless has been a killer feature for all of our asynchronous jobs and services. Unfortunately, the logging approach provided as part of the default template is not ideal. In this post, I'll introduce you to the first steps we take in all of our existing and new function apps to improve logging. A quick note about the Azure Functions runtime.

A Data Engineers Journey to Modernizing with Cribl

Terry Mulligan, is a Splunk consultant with Discovered Intelligence (and Notre Dame’s biggest fan)— a data intelligence services and solutions provider that specializes in data observability and security platforms. He shares what Cribl has brought to the table for his organization and his clients, and how it’s changed their processes and the role of the Splunk data engineer.

Achieve Optimal Performance with Nginx and Micro-Caching

The word "cache" is used in many different contexts. Typically, a cache is a small chunk of data stored locally for quick access. In this case, it’s about computer caches, i.e., the data stored in memory. Micro-caching is a technique where a programmer uses this cached data to do some quick computations, which can lead to some amazing solutions. In micro caching, dynamically generated content is cached for only a brief period rather than full-page caching.