Operations | Monitoring | ITSM | DevOps | Cloud
Monitoring
The latest News and Information on Monitoring for Websites, Applications, APIs, Infrastructure, and other technologies.
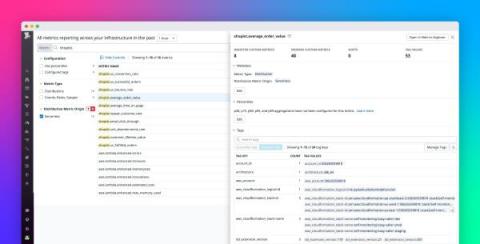
Exporting metrics to Datadog
geeks+gurus: Sumo Logic's Debut in the Gartner APM (&O!) Magic Quadrant
How to Increase PHP Memory Limits
Why are PHP memory limits important to your website development journey? PHP is a famous backend technology that is used by many tech giants for supporting their applications. PHP gives many advanced features for making web pages dynamic and integrating some features you can not simply get using javascript, HTML, and CSS. Whenever you set up a new PHP project, some memory is allocated automatically. This memory is mostly suitable for general applications.
TL;DR Geo-Temporal Data and InfluxDB
Geo-temporal data has both location and time. It’s used for all sorts of applications, from tracking shipments, to predicting weather patterns, to building fitness apps. It’s powerful because it lets you know where and when events happen, so you can understand them better and connect them with other events.
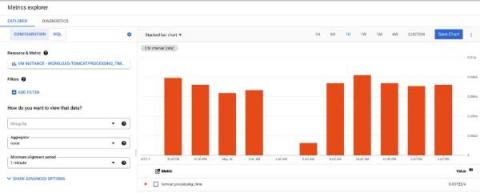
How to monitor JVM with OpenTelemetry
Shape the future of apps with AppDynamics Cloud
How to Troubleshoot Amplify APIs
One of the things we love about working in the cloud is the ease and scalability it brings to application development. It enables us to build out applications, APIs and any infrastructure that is needed from prototyping an idea, through to self scaling deployments. Monitoring and troubleshooting production-level serverless applications is always tricky, Especially working across a number of services and the many logs they can produce.
Introducing Mobile Screenshots and Suspect Commits
Nobody likes using an unstable mobile app or even worse, an app that crashes on them. In fact, 9 out of 10 US and UK consumers report uninstalling a mobile application due to poor performance. Crash rates and snappy experiences matter for all applications, but especially for mobile apps. Mobile app crashes and poor performance not only cause users to abandon an app but can also trigger the app to be ranked lower in Apple App Store and Google Play Store search results.
Monitor custom serverless metrics with the Datadog Lambda extension
When building serverless applications on AWS Lambda, Amazon CloudWatch provides out-of-the-box metrics that measure the performance, errors, and duration of your functions. Although these standard Lambda metrics provide visibility into your serverless applications, it can also be invaluable to monitor custom metrics that are unique to your use case and application.


