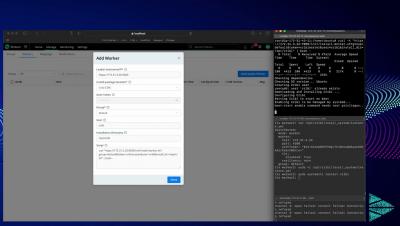
Enabling TLS on a Cribl Leader for both GUI and Worker to Leader communications
In this video, we demonstrate how to enable TLS on a Cribl Leader for both GUI and Worker to Leader communications.


The latest News and Information on Log Management, Log Analytics and related technologies.
Everyday when you come into work, you’re bombarded with a constant stream of problems. From service desk calls to network performance monitoring, you’re busy from the moment you login until the moment you click the “shut down” option on your device. Even more frustrating, your IT environment consists of an ever-expanding set of network segments, applications, devices, users, and databases across on-premises and cloud locations.
You’ve made the decision to implement a centralized log management solution because you know that it’s going to save you time and money in the long term. However, to get the most bang for your log management buck, you need to understand how the different parts of your log management deployment work. Once you understand each resource, you can implement a more efficient log management architecture.
To help our customers reduce their overall observability costs, we’re excited to announce the Data Optimization Hub as part of our Open 360™ platform. The new hub inventories all of your incoming telemetry data, while providing simple filters to remove any data you don’t need. Gone are the days of paying for observability data you never use.
Elastic Universal Profiling is based on technology that came into Elastic as part of the acquisition of optimyze.cloud — a startup that had developed Prodfiler.com, the world’s first frictionless fleet-wide in-production multi-runtime profiler that was launched in August 2021. In order to bring the vision of frictionless deployability, low performance overhead, “just run it everywhere” magic to the broader market, a number of technical innovations were necessary.
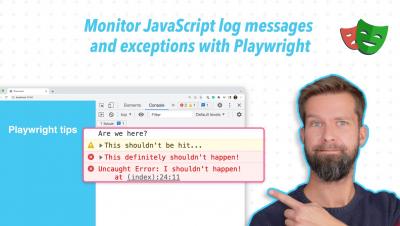
While developing elmah.io support for WPF, I had the chance to look into WPF for the first time in many years. I couldn't stop myself from digging down into all sorts of details about how logging has evolved in WPF since I last wrote a WPF app. In this post, I'll share some of the findings I made in this rediscovering journey.
Organizations have different data lakes they use to search, whether it is Splunk, Qradar, or Sumo Logic just to name a few. Exabeam (UEBA Advanced Analytics) sits on top of those existing data lakes and pulls specific sources by running continuous queries every few minutes into Exabeam. The image below shows a Splunk query to pull windows event logs into Exabeam Advanced Analytics over the port (8089). The query is complex.