How To Install Graylog On CentOS
Technical Marketing Manager, Ethan Keaton walks you through installing Graylog V5 on CentOS.


The latest News and Information on Log Management, Log Analytics and related technologies.
You may get lucky this holiday season with a new 3D printer, either as a gift or something you give yourself as a reward for all your hard work this year. Household 3D printers have made tremendous strides in ease of use and affordability over the last decade.
Log files and system logs have been a treasure trove of information for administrators and developers for decades. But with more moving parts and ever more options on where to run modern cloud applications, keeping an eye on logs and troubleshooting problems have become increasingly difficult.
Grafana Agent v0.30 is here! The past couple of Grafana Agent releases have been pretty exciting for us. We introduced Agent Flow as a new way to configure, run, and debug telemetry pipelines. We also announced OpenTelemetry Collector components to expand on our Big Tent philosophy and allow users to switch seamlessly between the Prometheus and OTel ecosystems. This latest release continues that momentum by introducing Loki components for building logging pipelines and marking Flow mode as beta!
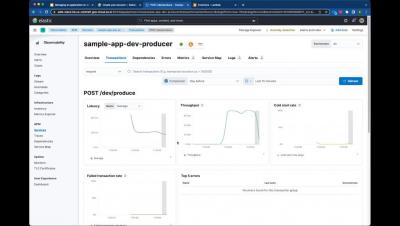
The structured nature of Kubernetes enables a repeatable and scalable means of deploying and managing services and applications. This has led to widespread adoption across market verticals for both on-premises and cloud deployment models. The autonomous nature of Kubernetes operation, however, demands comprehensive, fully-converged observability and security. This is uniquely possible today using the Elastic platform.