The latest News and Information on Monitoring for Websites, Applications, APIs, Infrastructure, and other technologies.
Monitoring is often not the first thing on the mind of the modern developer. Yet, it’s necessary at many points of the software development lifecycle, including: before deprecating an API, before launching a new feature, after launching the feature, and more. In fact, monitoring needs can vary much more than the classic Ops monitoring.
The public service of buses of Madrid, the EMT, was one of the protagonists of Global Mobility Call that took place the 14th and 16th of June in IFEMA. The company from Madrid exposed its future plans tracing the route to continue transforming the capital into a Smart City where sustainable mobility and independent vehicles acquire great relevance. Nevertheless, executing this plan would be impossible without a technology characterized by generating data on a steady basis.
Unless you stare at Sentry all day waiting for error or performance problems to pop up, chances are you rely on alerts to let you know when something breaks or slows down. There are two types of alerts you can set up: 1) Issue Alerts, which are tied to issues that meet predefined criteria, and 2) Metric Alerts, which trigger when error volume or performance metrics like apdex, latency, or throughput surpass a pre-defined threshold.
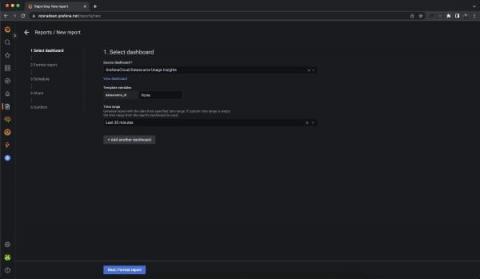
Behind every feature in Grafana, no matter how big or small, lies a lot of hard work, commitment, and attention to detail. At Grafana Labs, we use a cross-functional team approach to come up with ideas and solutions that ultimately make our products more usable, resilient, and adaptable to user needs. To achieve this, we work collaboratively across the UX, product, and engineering disciplines.
Our team has been hard at work this month to introduce 2 new parsing rules, DataMap improvements, updated tracing visualizations for SLA monitoring & more. Get up to speed on everything that’s new and improved in the Coralogix platform!