Operations | Monitoring | ITSM | DevOps | Cloud

The latest News and Information on Monitoring for Websites, Applications, APIs, Infrastructure, and other technologies.

Unlock the Secrets of Kernel Memory Usage

The mem.kernel chart in Netdata provides insight into the memory usage of various kernel subsystems and mechanisms. By understanding these dimensions and their technical details, you can monitor your system's kernel memory usage and identify potential issues or inefficiencies. Monitoring these dimensions can help you ensure that your system is running efficiently and provide valuable insights into the performance of your kernel and memory subsystem.
Code Instrumentation Practices to Improve Debugging Productivity

Code instrumentation is closely tied to debugging. Ask one of the experienced developers and they will swear by it for their day-to-day debugging needs. With modest beginnings in the form of print statements that label program execution checkpoints, present-day developers employ a host of advanced techniques for code instrumentation. When carried out in the right way, it improves developer productivity and also reduces the number of intermediate build/deployment cycles for every bug fix.

Introducing the Grafana Labs Bug Bounty Program

At Grafana Labs, we value the open source community and recognize the power of crowdsourcing. This is why we have decided to launch our very own bug bounty program, managed in-house by our own team, to encourage ethical hackers from around the world to help us find and responsibly report security vulnerabilities in Grafana Labs software.

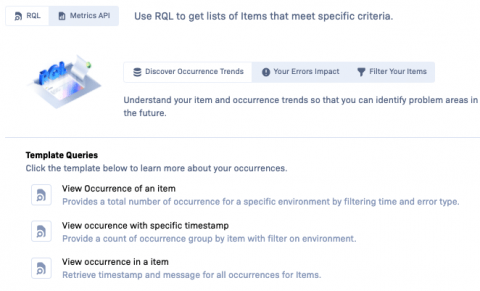
Introducing Rollbar Analyze

We are excited to announce the rollout of our new Rollbar Improve component, Analyze. As we strive to provide you with the best possible tools to monitor, understand, and improve your code, we've combined two powerful features, RQL and Metrics API, into one comprehensive package. Analyze is designed to deliver even more powerful insights to help your teams better understand your code and make data-driven decisions.

What is multi-tenancy? Multi-tenancy for MSPs Explained.

Multi-tenancy is an architecture in which a single instance of a software application and its underlying resources serves multiple customers, each customer is called a tenant. Multi-tenant architectures are the foundation of most SaaS offerings. Monitoring and troubleshooting multi-tenancy architectures can be challenging.A tenant can be an individual user, but more commonly, it is a group of users like a customer organization.

30 Best Network Performance Monitoring Software of 2023

In today's digital age, network performance monitoring (NPM) software has become a critical software for businesses of all sizes. With so many options available, choosing the right NPM software can be a daunting task. This article aims to guide you through the process of finding the right NPM software for your specific needs.

We tell you with lots of humor why monitoring your equipment is no laughing matter

Let’s face it, enough chit chat, without monitoring, your computer walks on a tightrope, 30 floors high and without safety net: a false movement and BAM! It’s over! Brains omelette for the pigeons of your neighborhood! Therefore, today, in the sacred and glaucous Pandora FMS blog, we bring you a series of testimonies, of real cases, sent by our esteemed users, where we ask them to tell us their miseries in exchange for taking the only moral possible.