Operations | Monitoring | ITSM | DevOps | Cloud

The latest News and Information on Monitoring for Websites, Applications, APIs, Infrastructure, and other technologies.

How to use Elasticsearch and Time Series Data Streams for observability metrics

Elasticsearch is used for a wide variety of data types — one of these is metrics. With the introduction of Metricbeat many years ago and later our APM Agents, the metric use case has become more popular. Over the years, Elasticsearch has made many improvements on how to handle things like metrics aggregations and sparse documents. At the same time, TSVB visualizations were introduced to make visualizing metrics easier.

Profiling from Sentry: Identify and Eliminate Performance Bottlenecks with Code-level Insight

Users are complaining about slow load times and you’ve thrown logs, traces, and metrics — heck, the entire kitchen sink of performance monitoring — at your application, but you still can’t figure out the source of the bottleneck. Maybe you missed adding instrumentation to something in the critical path, or you’re simply testing in an environment vastly different from the ones your users are experiencing in production.

Strengthen Your Security Strategy to Safeguard Against Migrations Risks

In part 1 of this post, we talked about how Cribl is empowering security functions by giving our customers freedom of choice and control over their data. This post focuses on their experiences and the benefits they are getting from our suite of products. In a past life, I was in charge of security and operational logging at Transunion — around 2015, things started going crazy.

This Month in Datadog: DASH 2023, In-App WAF and User Protection, Cloudcraft for Azure, and more!

Datadog is constantly elevating the approach to cloud monitoring and security. This Month in Datadog updates you on our newest product features, announcements, resources, and events. This month, we put the Spotlight on DASH 2023..

Deciphering Complex Logs With Regex Using BindPlane OP and OpenTelemetry

Parsing logs with regex is a valuable technique for extracting essential information from large volumes of log data. By employing this method, one can effectively identify patterns, errors, and other key insights, ultimately streamlining log analysis and enhancing system performance.

Monitor OTel-instrumented apps with support for W3C Trace Context

To get visibility into highly distributed applications, organizations often use various tracing tools that are best suited to each individual service owner’s specifications. However, when a request travels between services that have been instrumented with different tools, the trace data may be formatted differently, resulting in broken traces.

Streamlining Troubleshooting for Work-from-Home Users: Tips for Effective Active Monitoring

It may feel like ancient history, but it was only a few years ago that, in response to the pandemic, organizations made a wholesale shift to support hybrid work models—and did so literally overnight, in many cases. While some time has passed, this is a shift to which many IT organizations are still struggling to fully adapt.

Feature Spotlight: Kubernetes Remediation Guides Make Everyone Effective in Troubleshooting

If you're accustomed to running software in production, you know that every minute counts when there's a disruption. However, not every issue is obvious enough to immediately find and remediate. That can be a big obstacle to overcome, which is where StackState's Kubernetes remediation guides come into play. They contain expert knowledge that guides you step by step to understand the issue, enabling swift remediation.

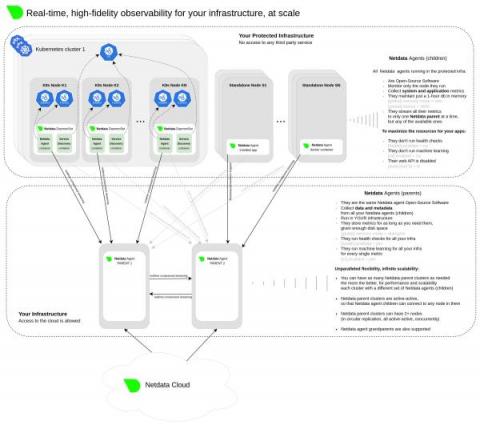
Monitoring to Infinity and Beyond - How Netdata Scales Without Limits

Scalability is crucial for monitoring systems as it ensures that they can accommodate growth, maintain performance, provide flexibility, optimize costs, enhance fault tolerance, and support informed decision-making, all of which are critical for effective infrastructure management.

Monitoring Disks: Understanding Workload, Performance, Utilization, Saturation, and Latency

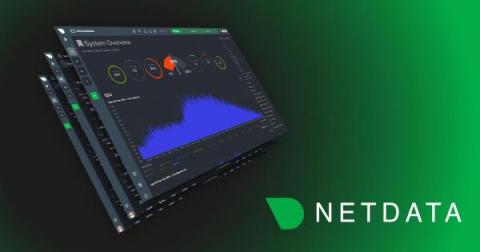
Netdata provides a comprehensive set of charts that can help you understand the workload, performance, utilization, saturation, latency, responsiveness, and maintenance activities of your disks. In this blog we will focus on monitoring disks as block devices, not as filesystems or mount points. The Disks section in the Overview tab contains all the charts that are mentioned in this blog post.