Operations | Monitoring | ITSM | DevOps | Cloud

The latest News and Information on Monitoring for Websites, Applications, APIs, Infrastructure, and other technologies.

Understanding AWS Lambda proactive initialization

AJ Stuyvenberg is a Staff Engineer at Datadog and an AWS Serverless Hero. A version of this post was originally published on his blog. In AWS Lambda, a cold start occurs when a function is invoked and an idle, initialized sandbox is not ready to receive the request. Features like Provisioned Concurrency and SnapStart are designed to reduce cold starts by pre-initializing execution environments.
Environment backup and recovery

Backup copies are an almost mandatory prevention method in any environment in order to have the most critical elements secured against possible damages or loss of information. For this reason, today we bring you this video where we are going to see how to make security copies of the main elements of Pandora FMS and how to recover them in a very simple way.

A practical guide to data collection with OpenTelemetry and Prometheus

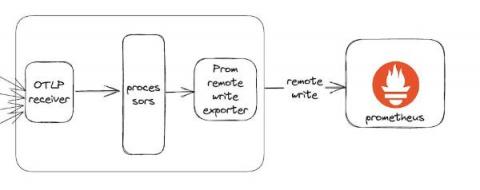
Grafana Labs has always been actively involved in the OpenTelemetry community, even working with the predecessor projects OpenTracing and OpenCensus. We have been supporting OTLP as the primary input protocol for our distributed tracing project, Grafana Tempo, since its inception, and our Grafana Agent embeds parts of the OpenTelemetry Collector.

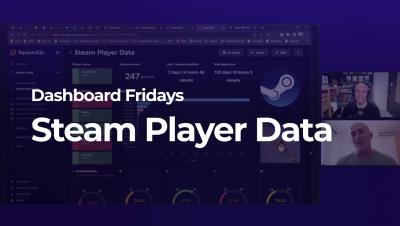
Dashboard Fridays: Steam Player Data

This is a fun dashboard to capture some Steam player statistics using the WebAPI plugin. Created by SquaredUp's Director of Engineering, Josip Dlaka, this handy dashboard displays how long his kids have been online, how many friends they have, and what they have achieved without even leaving their room! SquaredUp allows you to combine and visualize data from multiple data sources in a meaningful way, so this aesthetically pleasing dashboard gives a good overview of key Steam player metrics in Josip's household.

Digital Experience Monitoring: What it is and Why it Matters

The art of monitoring the influence of an application’s performance on business outcomes is constantly evolving. It used to be directing IT teams to act on insights from an Application Performance Monitoring (APM) solution was enough to drive business outcomes. Now we know the user experience has a heavy hand in determining whether a digital platform survives or dies. An APM solution keeps tabs on the performance of application components such as servers, databases, and services.

Incident Management Steps and Best Practices

According to the Uptime Institute’s 2022 Outage Analysis report, one out of every five companies has experienced a “serious” or “severe” incident over the past three years—a percentage that’s increasing. Those incidents are expensive: over 60% cost more than $100,000, while 15% set their companies back close to $1 million.

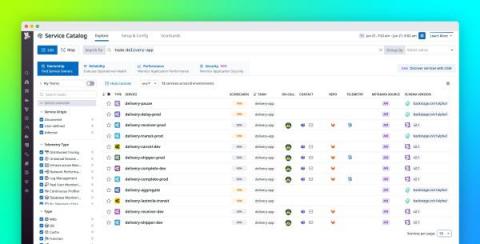
Import Backstage YAML files into Datadog to manage all your services in one place

The Datadog Service Catalog centralizes your organization’s knowledge about the ownership, reliability, performance, costs, and security of your services. If you’re also using Backstage to keep track of your services, you can leverage our support for Backstage YAML to easily consolidate and maintain all your service information in the Service Catalog.

Different Access for Different Roles: Cribl's New Authorization Support for Enhanced Security

When working with sensitive data, there’s no skimping on security. Keeping data protected and private is paramount at Cribl, which is why we prioritized building a robust framework for Role-Based Access Control (RBAC), and with this latest release, we created an authorization system across the entire Cribl suite. WOOHOO!!