Operations | Monitoring | ITSM | DevOps | Cloud

The latest News and Information on DevOps, CI/CD, Automation and related technologies.

Deploy packages from a Cloudsmith repository with Puppet

Puppet is a Continuous Configuration Automation tool that’s you can use to automate the configuration of your entire infrastructure. You can use it to manage the configuration of anywhere from a few, to thousands of servers or devices. Puppet consists of two main components: The Puppet Server The Puppet server is where you create and store your configurations and define which nodes specific configurations will be applied to.
Kubernetes 1.19 release candidate available for testing

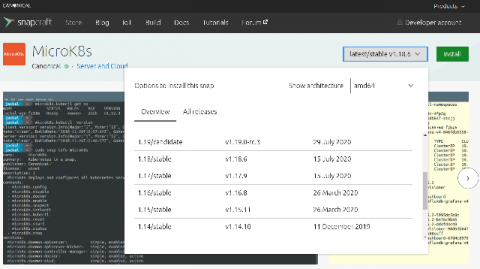
The Kubernetes 1.19 release candidate is now available for download and experimentation ahead of general availability later this month. You can try it now with MicroK8s. To get the latest Kubernetes on your machine, install MicroK8s and get a lightweight, zero-ops K8s cluster in no time: Or install from https://snapcraft.io/microk8s and select 1.19/candidate You can install MicroK8s on Ubuntu and all major Linux distributions or on Windows and macOS using native installers.

Continuous Deployment vs. Continuous Delivery: What is the difference?

Being in the DevOps space, we're often asked questions about software deployment like, "What's the difference between continuous deployment and continuous delivery?", "What is continuous deployment?", and "Are continuous deployment and continuous delivery the same thing?" So first, let's start by clearly defining these terms.

My first Kubernetes cluster: Amazon EKS review + tutorial

During my career, I’ve taken part in many on-call rotations and post-mortems. The longest on-call rotation I’ve ever had — no breaks, vacations, or holidays — lasted for a whopping 2.5 years at Lucid Software. I’m jaded. I strongly prefer stability to tinkering with shiny new toys. Very few software engineers start this way, but enough of them make the transition after having been bit enough times by a bad release.

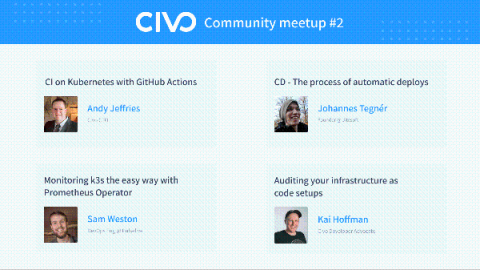
Civo Community Meetup #2: CI/CD focus w/ Sam Weston and Johannes Tegnér

For our second community meetup we focussed on using Civo for CI/CD through GitOps and Github actions for cloud native application development This installment featured talks from our CTO Andy, our Developer Advocate Kai, and guest talks from community members Sam Weston and Johannes Tegnér. The talks touched on a wide variety of topics within CI/CD, from automating builds to monitoring and observability. Here's what was on the agenda...

The Pain of Debugging WebAssembly

If you know anything about WebAssembly (WASM), it’s probably that WASM lets you execute code compiled from languages such as C, C++, Rust, or others in the browser at almost native speeds. You might be less familiar with the fact that WASM is not only an interesting technology in the browser, but also in other environments that require fast sandboxing. As such, WASM has found some popularity with edge computing and as a lightweight docker replacement for certain situations.

Hands-on-lab - Manage Software Releases with JFrog Distribution

Manage Software Releases with JFrog Distribution Whether you are delivering web services using Kubernetes or updating the latest firmware to an IoT device, the ability to deliver the latest features of your software solution in shortened development cycles is becoming more prevalent. In this webinar, we will demonstrate how to easily increase your release velocity while ensuring security and reliability using JFrog Distribution. Learn how JFrog Distribution can help overcome limited bandwidth networks and network lag, allowing you to accomplish updates with speed and reliability.

Netdata Agent v1.24: Prometheus/OpenMetrics collector and multi-host database mode

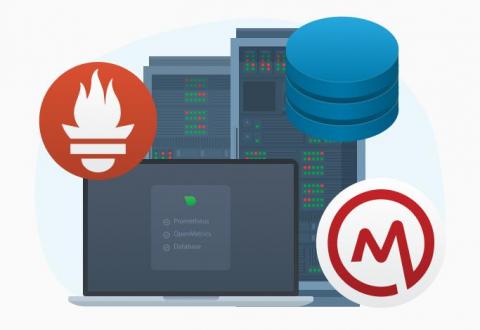
This release broadens our commitment to open standards, interoperability, and extensibility with a new generic Prometheus collector that works seamlessly with any application that makes its metrics available in the Prometheus/OpenMetrics exposition format, including support for Windows 10 via windows_exporter. Netdata will autodetect over 600 Prometheus endpoints and instantly generate charts with all the exposed metrics, meaningfully visualized.