OpsRamp for MSPs
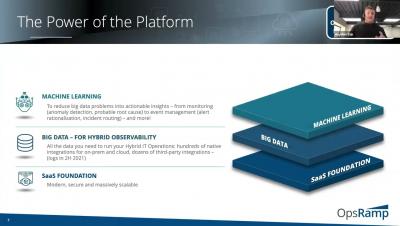
OpsRamp is the multi-tenant, multi-tiered platform for choice for global MSPs looking to expand revenue, manage client infrastructure and transform how they do business.


In this article, we’re going to explore key reasons why companies need status pages. We’ll also dive into the components of an accurate status page that does its job well. This will make it easier for you to set up your own status page, even if you’ve never done it before.
The managed security services market is booming. Coming in at $22.8 billion in 2021, it is projected to nearly double in just five years and grow to $43.7 billion by 2026. Moreover, cloud-based managed security services are poised to be the major growth driver for the broader MSP market, coming in at $219.59 billion in 2021, and expected to reach $557.10 billion by 2028. As we can see, providing robust security services is a key competitive differentiator for the lucrative MSP market.
The holiday season is here, and global retailers are prepared for the biggest retail event of the year. The decrease in new COVID-19 cases, coupled with a rise in vaccination rates, provides a glimmer of hope for shoppers looking to spend for friends and family. Holiday spending is expected to break previous records this year, growing up to 10.5 percent over 2020.
They are like 5 stages of an incident: 1. Assess impact 2. Inform customers (statuspage) 3. Identify the issue 4. Mitigate the issue 5. Resolve the incident Then there’s followup and further work. Also important to note that (2) should be ongoing as you progress. Updating the status page should be done within reasonable periods – e.g. every 15-20 mins unless you specify otherwise.
Adaptive Alerts is a new feature from Rollbar that adds to our reliable, informative and actionable alerts about unexpected issues in monitored applications and services. Adaptive Alerts uses anomaly detection to learn the standard behavior of enterprise applications, and alerts developers about atypical exception rates, reducing unwanted noise.
A common DevOps use case involves alerting when hosts stop reporting metrics, aka a deadman alert. This can be done using the monitor.deadman() Flux function. One can easily create a deadman (or threshold) check in the InfluxDB UI Alerts section or craft a custom task to alert as well. Check out InfluxDB’s Checks and Notifications system post for more details. It’s also possible to use the monitor.deadman() function directly in a dashboard cell.
Our December update brings a ‘Who is on duty’ board displaying current team members on duty with contact information. In addition, we have simplified the manual sending of Signls and improved the integration with Azure Sentinel. As always, you can find all the details in this article.
Watchdog is Datadog’s machine learning and AI engine, which leverages algorithms like anomaly detection to automatically surface performance issues in your infrastructure and applications. Without any manual setup or configuration, Watchdog generates a feed of Alerts—on anomalies such as latency spikes, elevated error rates, and network issues in cloud providers—to help you reduce your mean time to detection.