Mailchimp
Not subscribed to OpsMatters Newsletter


Setting up a proper monitoring overview over your application’s performance is a complex task. Normally, you’d first need to figure out what you need to monitor, then instrument your code, and finally make sense of all the data that has been emitted. However, with a few things set in place, and an APM that natively supports Ruby, it’s easier than ever to take this step. In this post, we’ll show you how you can do it too.
Take the 2021 State of DevOps Survey here. This year marks the 10-year anniversary of our industry-defining State of DevOps research. You’d think after 10 years that there wouldn’t be much more to say about DevOps, but practices and technologies continue to evolve, the best keep getting better, and we keep unearthing new topics to research.
This Logz.io Infrastructure Monitoring tutorial will cover how to get started with our latest product, our new Prometheus-as-a-Service metrics solution that’s based on Prometheus. Engineers monitor metrics to understand CPU and memory utilization for infrastructure, duration and serverless execution, or for network traffic. For more advanced metrics monitoring operations, teams can send custom metrics to monitor signals like the number of active users.
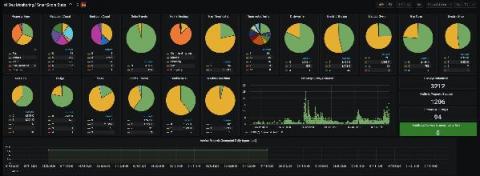
When a website is compromised to steal credit card information, a link to a malicious JavaScript file is normally inserted into the website’s code. This file then loads what is called the skimmer, the code responsible for skimming personal and financial details from customers.
Energy efficiency is a term often used to describe appliances or light bulbs. But when it comes to business, making sure your sales team — and customers — are being efficient with their personal energy is a big key to success. That was a major lesson learned by Utilita, the U.K.’s first and only specialist Smart Pay As You Go Energy supplier.