Mailchimp
Not subscribed to OpsMatters Newsletter


Metrics Explore is the Logz.io feature for deep dives into Prometheus metrics. Similar to Kibana Discover, it allows for easy querying, pull-down list selections, and other ways to navigate your data. Best yet, you can explore important metadata for detailed metric analysis. There are a few ways to move around the metrics in your system. Get started by finding the Explore icon on the left-hand menu.
We're very proud to announce that we have been accepted by the Cloud Native Computing Foundation (CNCF) as a conformant Certified Kubernetes provider for our v1.20 Civo Kubernetes product based on K3s. Every small business starts with a goal of competing with the big fish of the industry, and a huge part of that is having the certification to prove you're providing a compatible service. We're now in the company of some really inspirational organisations...
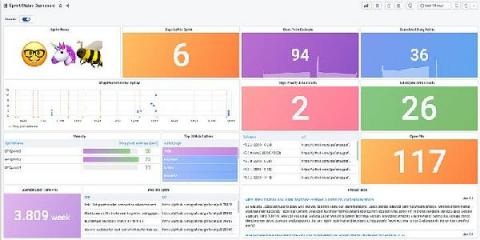
A very fun part of my job as a Solutions Engineer at Grafana Labs is getting to learn the ins and outs of a new feature or play with a plugin while it is still in development. So, when I heard murmurs that our latest Enterprise plugin would be an integration with Jira, I felt the forsaken call of the agile sirens luring me back to my days when I worked as a technical writer on a product team.
Network monitoring is the process of looking after your network with the help of various tools and techniques. These tools that are often called network monitoring systems constantly track various aspects concerning your network, such as bandwidth usage, traffic, etc. This tracking is important in case of outages as these systems notify the network administrator immediately. Moreover, network monitoring systems are essential for status updates so that you can improve your system’s efficiency.