Operations | Monitoring | ITSM | DevOps | Cloud

Blog

Raygun Application Performance Monitoring is here

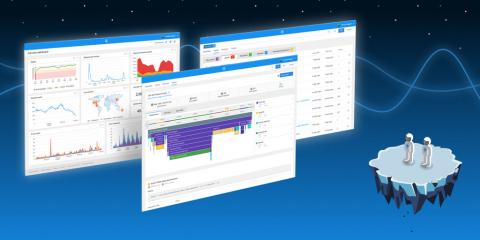
When you’re building software, there’s so much to think about — from bugs to how fast your application loads. We’ve got something new to help your development team build better, faster experiences for your users, in less time. Today, we’re releasing Raygun Application Performance Monitoring (APM) for .NET, a new way to visualize and understand your application’s performance on the server-side.

Managing Python Processes with PM2

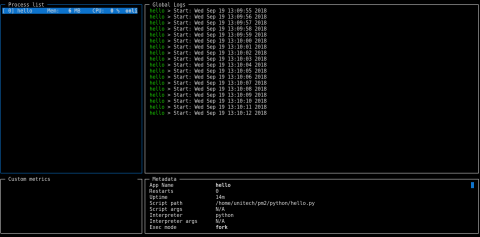
PM2 is a production-grade process manager that makes management of background process easy. In the Python world we could compare PM2 to Supervisord, but PM2 has some nifty features you might like. With PM2, rolling restarts, monitoring, checking logs and even deploying application has never been that simple. We really value CLI UX, so PM2 is really simple to use and master.

Digital Transformation: Enough Talk, It's Time for Action. Fuel Your Progress with ServiceNow and LogicMonitor

A recent study from Mulesoft shows that 75% of enterprises have moved past the digital transformation planning stage to rolling up their sleeves and diving into implementation. Teams are updating their IT Operations Management (ITOM) strategies, moving more systems and services to the cloud, and automating tedious manual processes that have historically been the root cause of migraines for many people.

Log analytics and dashboarding in Datadog

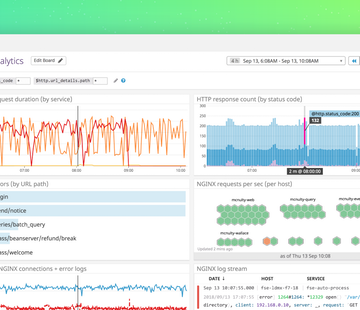
Achieving optimal performance can be challenging when you depend on separate platforms to monitor service health and to manage your logs. When data about your systems is spread across multiple platforms, investigating issues—and ultimately resolving them—takes longer and requires expertise with more tools. It takes more effort to identify real customer impact, as well as to verify that your responses to an incident are having the desired effect.

Alert fatigue, part 2: alert reduction with Sensu filters & token substitution

In my previous post, I talked about the real costs of alert fatigue — the toll it can take on your engineers as well as your business — and some suggestions for rethinking alerting. In part 2 of this series, I’ll share some best practices for fine-tuning Sensu to help reduce alert fatigue.

Alert fatigue, part 1: avoidance and course correction

Alert fatigue occurs when one is exposed to a large number of frequent alarms (alerts) and consequently becomes desensitized to them. This problem is not specific to technology fields: most jobs that require on-call, such as doctors, experience it in slightly different manners, but the problem is the same.

Super Monitoring Decorated with 2 Distinctions for Application Performance Monitoring Software

Super Monitoring was recently lauded by a popular software review platform for its steadfast assistance in keeping everyone’s business operations smooth and seamless at all times. For its efficiency in informing users regarding emerging issues and anomalous threats, Super Monitoring was distinguished by the FinancesOnline SaaS review platform with two prestigious awards for 2018: Great User Experience and Rising Star.

Sentry + Microsoft Azure DevOps: Error-Tracking, Crash-Reporting, & More

Sentry is updating our key integrations for Azure DevOps (formerly VSTS). With these tightly-woven integrations, developers (like you) can unlock enhanced release tracking, informative deploy emails, and assignee suggestions for new errors. Route alerts to the right person based on the Azure DevOps commit that caused the issue, cutting remediation time to five minutes.

Connect Insights to Real-Time Action With PagerDuty Visibility

Have you ever gotten that dreaded text from your boss: “The site is down”? Maybe you were meeting with a customer. Or having dinner with your family. Maybe you were presenting at a conference. Doesn’t matter. Whatever else you were doing, now you’re doing emergency incident communication too. You check in with your team leads and confirm there is a problem. You let your boss know the response is under way.

Will Layer 3 Switches Give Routers the Boot?

Switches are the most common network device deployed on MSP-managed networks, while routers are the least popular—and not by a small margin. The data in Auvik’s recently published report, Managing Network Vendor Diversity: The MSP Challenge, shows switches represent almost half (48%) of all network devices on MSP-managed sites, while routers account for only 6% of the total. Does this mean the death of the router is imminent? In short, no—and here’s why.