Operations | Monitoring | ITSM | DevOps | Cloud

Blog

Serverless with AWS - Image resize on-the-fly with Lambda and S3

Handling large images has always been a pain in my side since I started writing code. Lately, it has started to have a huge impact on page speed and SEO ranking. If your website has poorly optimized images it won’t score well on Google Lighthouse. If it doesn’t score well, it won’t be on the first page of Google. That sucks.

The Top 6 Cyber Threats that Keep Businesses up at Night

Few things put more fear into the hearts of IT departments than the thought of a massive cyber attack — and for good reason. In 2017, the average cost of security breaches for U.S. organizations was estimated at $3.5 million. But it’s not all about the money. In addition to the financial burden caused by cyber attacks, the loss of client trust and credibility post-breach can be extremely difficult to bounce back from.

Achieving Rapid Time-to-Value with AppDynamics

At AppDynamics, we are firm believers in demonstrating the value of our platform as quickly as possible. Many of our customers are able to address critical performance issues within minutes of getting their application instrumented. Below is an example of how we use AppDynamics with a fictional customer, AD-Betting, to analyze and troubleshoot the company’s business environment soon after AppD is up and running.

Monitoring Java applications: Memory usage, threads and other JRE metrics

In this post we will cover how to monitor the Java Runtime Environment (JRE). You will learn how to assess the performance of your Java application by profiling its memory usage, the garbage collector metrics, monitoring Java daemon and user threads and other fundamental JRE metrics. We will finish with a real Java JRE troubleshooting example using opensource Sysdig and Docker.

New: Debug performance issues by comparing two IPM tests

Our Intelligent Page Monitor (IPM) is a great tool for several different reasons. It will detect element errors (e.g. 404s). It’s fantastic for AB testing. It captures a regular screenshot of your page. It runs from locations all around the world. And it’s a powerful performance monitor, giving you statistics for every element loaded on a page.

Take Your Monitoring Insights to another Level Using New Analytic Views

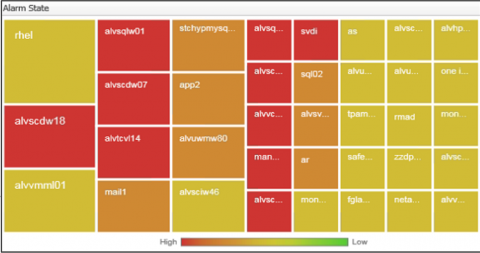
Foglight 5.9.3 (core Foglight release) includes among its features new components for building dashboards called “analytic views”. The new view types are: Scatter Plot Chart, Bubble Chart and Tree Map Chart. Specifically, I’ll cover here how to use these in the Foglight “Drag and Drop” interface to easily create new views that can show your monitoring data in new, powerful ways.

The Role of Dashboards and Portals in IT Performance Monitoring

Managing the end-user experience has become the basis of competition in the digital services world. Most IT organizations today are looking for a portal for managing the performance of digital business services – and a portal is much more than a simple dashboard.