Operations | Monitoring | ITSM | DevOps | Cloud
DevOps
The latest News and Information on DevOps, CI/CD, Automation and related technologies.
Key questions to ask when setting SLOs
Many organizations rely on service level objectives (SLOs) to help them gauge the reliability of their products. By setting SLOs that define clear and measurable reliability targets, businesses can ensure they are delivering positive end-user experiences to their customers. Clearly defined SLOs also make it much easier for businesses to understand what tradeoffs they may have to make in order to deliver those specific experiences.
Checkly Advances Monitoring as Code with New User-Centric Features
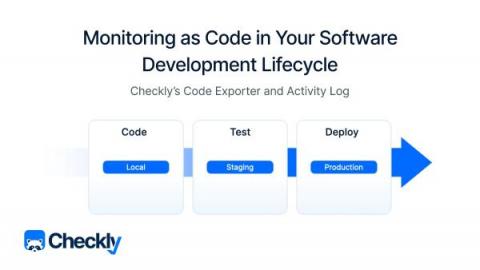
Monitoring as Code in Your Software Development Lifecycle
When we launched the Checkly CLI and Test Sessions last May, I wrote about the three pillars of monitoring as code. Code — write your monitoring checks as code and store them in version control. Test — test your checks against our global infrastructure and record test sessions. Deploy — deploy your checks from your local machine or CI to run them as monitors.
How to monitor CoreDNS with Datadog
In Part 1 of this series, we introduced you to the key metrics you should be monitoring to ensure that you get optimal performance from CoreDNS running in your Kubernetes clusters. In Part 2, we showed you some tools you can use to monitor CoreDNS. In this post, we’ll show you how you can use Datadog to monitor metrics, logs, and traces from CoreDNS alongside telemetry from the rest of your cluster, including the infrastructure it runs on.
Tools for collecting metrics and logs from CoreDNS
In Part 1 of this series, we looked at key metrics you should monitor to understand the performance of your CoreDNS servers. In this post, we’ll show you how to collect and visualize these metrics. We’ll also explore how CoreDNS logging works and show you how to collect CoreDNS logs to get even deeper visibility into your Deployment.
Key metrics for CoreDNS monitoring
CoreDNS is an open source DNS server that can resolve requests for internet domain names and provide service discovery within a Kubernetes cluster. CoreDNS is the default DNS provider in Kubernetes as of v1.13. Though it can be used independently of Kubernetes, this series will focus on its role in providing Kubernetes service discovery, which simplifies cluster networking by enabling clients to access services using DNS names rather than IP addresses.
AzCopy and Azure File Sync: How They Work Together
In the ever-expanding landscape of Azure data management, two powerful tools emerge as essential assets for tech professionals: AzCopy and Azure File Sync. While each has its unique capabilities, together they create an intricate symphony that enhances data transfer and synchronization within Azure. In this comprehensive guide, we’ll unravel the functionalities of both, explore their common use cases, delve into their integration processes, and weigh their benefits and drawbacks.
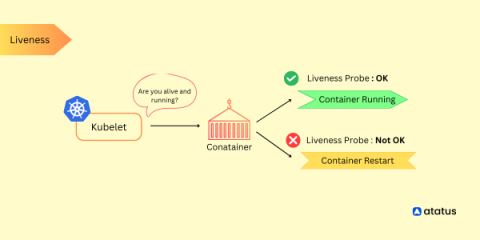
Kubernetes Liveness Probe Guide
Kubernetes liveness probes are a critical component for monitoring the health and availability of application containers running within a Kubernetes cluster. They allow Kubernetes to determine whether a container is running as expected and take appropriate actions if it is found to be unresponsive or in an unhealthy state. Liveness probes periodically check the health of containers by sending requests to a specified endpoint or executing a command within the container.
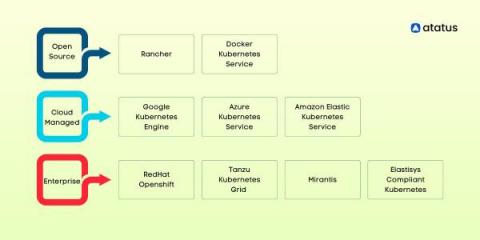
9 Popular Kubernetes Distributions You Should Know About
Kubernetes has become the go-to platform for container orchestration, allowing teams to more efficiently manage their containerized applications. Vanilla Kubernetes, as well as managed Kubernetes, are the two options available when building up a Kubernetes system. A group of programmers using vanilla Kubernetes must download the source code files, follow the code route, and set up the machine's environment.


