Operations | Monitoring | ITSM | DevOps | Cloud

Monitoring

The latest News and Information on Monitoring for Websites, Applications, APIs, Infrastructure, and other technologies.

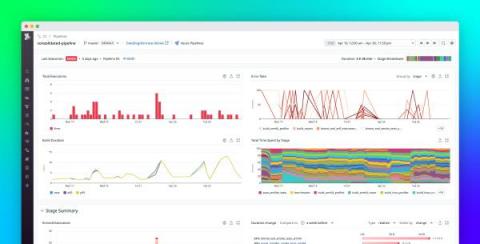
Monitor Azure Pipelines with Datadog CI Visibility

End-to-end visibility into pipelines is crucial for ensuring the health and performance of your CI system, especially at scale. Within extensive CI systems—which operate under the strain of numerous developers simultaneously pushing commits—even the slightest performance regression or uptick in failure rates can compound rapidly and have tremendous repercussions, causing major cost overruns and impeding release velocity across organizations.

Correlating Metrics, Traces, & Logs-Without the Swivel Chair

Correlation in monitoring and observability refers to the process of analyzing different types of data to identify and understand relationships between application, network, and infrastructure behavior. Correlating these data sets can help IT teams identify all technology components contributing to or impacted by a performance or reliability issue, thereby empowering them to identify root cause and troubleshoot faster.

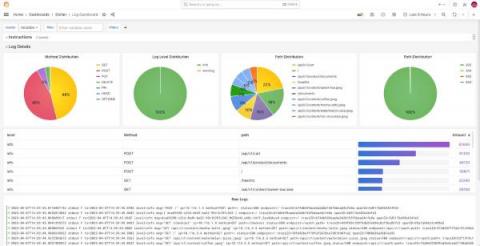
6 easy ways to improve your log dashboards with Grafana and Grafana Loki

Because of where you’re reading this post, I’m going to assume you already know that Grafana is a great tool for visualizing and presenting metrics, and persisting them on dashboards. Ever since the Grafana Loki query builder for LogQL was introduced in 2022, it’s been easy to display and visualize logs, too.

From logs to insights: Using Firewall Analyzer to monitor Squid proxy activity

Squid proxies are among the most popular open-source proxy servers preferred by companies across the globe to keep their networks safe and boost performance. Since Squid proxy’s release in 1996, companies have preferred it for its high-performance proxying, forwarding, and caching functions. Squid proxy logs contain information about the HTTP traffic passing through a server. This includes the source IP, destination IP, time of the request, and accessed URL.

Citizen Developers: How Citizen Development Works & Reduces Dev Shortages

Business applications can be a powerful tool and streamline almost any business process. As a result, many companies and their team members are requesting mobile apps to reduce costs and enhance efficiency. The problem? There aren’t enough developers to build these apps for them. In fact, more than a third of respondents in a recent survey said that recruiting developers will continue to be challenging in 2023.

How Endeavor Streaming Accelerates Metrics with Logz.io

The platform development team at Endeavor Streaming has a critical mission — from balancing operation of the company’s leading digital video platform, at scale, to ensuring everything in their complex cloud environment is performing as expected. Enabling the company to confidently build on top of its platform and continue to evolve their product delivery is thereby also dependent on maintaining detailed visibility into its supporting cloud applications and infrastructure.

Identify unused, costly metrics with Cardinality Management dashboards in Grafana Cloud

Organizations are dealing with an explosion of metric data as they shift to cloud native architectures and adopt tools like Prometheus and Kubernetes. This in turn can lead to surges in spending on observability metrics. So while teams want a way to scale out metrics adoption to improve their observability — and thus, improve system performance and reliability — they also need to be mindful of skyrocketing costs that could scuttle those efforts before showing meaningful results.