Operations | Monitoring | ITSM | DevOps | Cloud

Monitoring

The latest News and Information on Monitoring for Websites, Applications, APIs, Infrastructure, and other technologies.

From Business Challenges to Solutions: The Requirements of Being a Solution Architect

Imagine being at the helm of a technological maze, ready to decipher and implement emergent trends like artificial intelligence, edge computing, and microservices. The impact is enormous - enabling efficient business operations and fostering growth. Enter experienced Solution Architects. As the lifeblood of the business strategy and as a Solution Architect, you transform complex challenges into innovative opportunities.

Why you should prioritize VMware performance monitoring in the face of rising server virtualization

Virtualization has been a rising trend in IT. A recent study of the server virtualization market revealed that in 2019, only half the servers in the world (55.6%) were purely physical, the remainder being virtual. Among virtual servers, VMware had the largest share at around 20.8%. The use of virtual servers has grown to the extent where this blog you’re currently reading is probably hosted on a virtual server.

Infrastructure is Fundamental: Learn Your Hybrid Cloud ABCs

In 21st-century business, computing is what makes daily operations, competitive advantage, and strategic growth possible. The foundation that enables this is a hybrid cloud infrastructure that supports business requirements, delivers a suitable user experience, and stays on budget. Mastering the ABCs of infrastructure performance management (IPM) will put you on the road to long-term success.

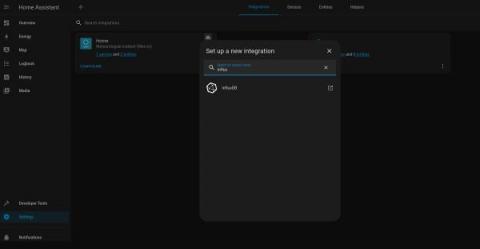
How to Integrate Grafana with Home Assistant

This post covers how to get started with Home Assistant and Grafana, including setting up InfluxDB and Grafana with Docker, configuring InfluxDB to receive data from Home Assistant, and creating a Grafana dashboard to visualize your data. It provides a comprehensive guide for real-time monitoring and analysis of Home Assistant data. In this tutorial, you’ll learn how to integrate Grafana with Home Assistant using InfluxDB.

How to start monitoring your ClickHouse instance or cluster with Grafana Cloud

ClickHouse is an open source, column-oriented database management system designed for OLAP (analytical) workloads. ClickHouse supports various data formats and SQL queries, and is popular for clickstream analysis as well as log processing use cases. We are pleased to announce that ClickHouse now has a dedicated observability integration in Grafana Cloud, which makes it easy to troubleshoot issues, track potential latency, and prevent data loss.

How to Use OpenTelemetry & JavaScript Together: A Tutorial

This post was written by Siddhant Varma. Scroll down for the author’s bio. Observability is an essential aspect of a healthy software architecture and a highly performant system. It enables developers and engineers to understand and dive deeper into how their application behaves. This in turn helps them monitor it effectively.

The new ransomware-as-a-service (RaaS) operation MichaelKors

A new ransomware-as-a-service (RaaS) operation called MichaelKors has recently emerged, which targets Linux and VMware ESXi systems. The cybersecurity firm CrowdStrike warns that this trend is significant since ESXi does not support third-party agents or antivirus software which makes it an attractive target for cybercriminals.

What is Applied Observability?

There’s a new term on the technology block: Applied Observability. Gartner estimates that 70% of organizations will successfully adopt applied observability capabilities in coming years. The most common use cases of applied observability will include: But exactly what is applied observability? We’ve got the answers and more here for you to get a full understanding. Read on!