Operations | Monitoring | ITSM | DevOps | Cloud

Monitoring

The latest News and Information on Monitoring for Websites, Applications, APIs, Infrastructure, and other technologies.

Parquet File Format: The Complete Guide

How you choose to store and process your system data can have significant implications on the cost and performance of your system. These implications are magnified when your system has data-intensive operations such as machine learning, AI, or microservices. And that’s why it’s crucial to find the right data format. For example, Parquet file format can help you save storage space and costs, without compromising on performance.

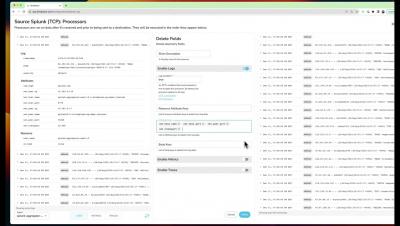
Deleting Fields with BindPlane OP

Are you ingesting unnecessary fields? See how to use the "Delete Fields" processor to remove fields from your log stream in BindPlane OP. Then use our live preview capabilities to see the changes prior to rolling out to your agents. About ObservIQ: observIQ brings clarity and control to our customer's existing observability chaos. How? Through an observability pipeline: a fast, powerful and intuitive orchestration engine built for the modern observability team. Our product is designed to help teams significantly reduce cost, simplify collection, and standardize their observability data.

How to deploy Hello World Elastic Observability on Google Cloud Run

Elastic Cloud Observability is the premiere tool to provide visibility into your running web apps. Google Cloud Run is the serverless platform of choice to run your web apps that need to scale up massively and scale down to zero. Elastic Observability combined with Google Cloud Run is the perfect solution for developers to deploy web apps that are auto-scaled with fully observable operations, in a way that’s straightforward to implement and manage.

LogicMonitor Kubernetes Helm Monitoring

LogicMonitor recently added support for monitoring Kubernetes Helm Charts. This new module helps customers clearly see the health and performance of their Kubernetes applications, quickly respond when configured metrics exceed thresholds or deviate from patterns, and take action on critical issues to detect anomalies or issues early on.

Detecting Performance Monitoring Issues in Prometheus & Grafana | 2023 Guide

Stay ahead of performance hiccups with our comprehensive Prometheus & Grafana monitoring tutorial. From setup to advanced detection techniques, this guide ensures your systems run smoothly. Facing challenges or want to exchange tips? Connect with peers and mentors in our dedicated community space.

Advanced Monitoring and Observability Tips for Kubernetes Deployments

Cloud deployments and containerization let you provision infrastructure as needed, meaning your applications can grow in scope and complexity. The results can be impressive, but the ability to expand quickly and easily makes it harder to keep track of your system as it develops. In this type of Kubernetes deployment, it’s essential to track your containers to understand what they’re doing.

Introducing Error Groups to the Raygun API

We’re excited to announce an important extension to our API. After rigorous research, testing, and feedback, we’ve launched the Error Groups endpoints. This powerful new addition aims to enhance your monitoring experience and better handle errors across your applications. Our primary aim with the introduction of these endpoints is to offer you a more detailed view into your applications’ error groups, and to offer a way to update their statuses using the API.

25 Essential Salesforce Monitoring Strategies for Optimal Performance and Security

In this definitive guide, we present to you the “25 Essential Salesforce Monitoring Strategies for Optimal Performance and Security.” The health of your CRM environment is pivotal to your organizational success. From analyzing user activity to optimizing API usage, from monitoring data quality to fortifying compliance measures, we’re here to equip you with the tools and knowledge to thrive.

Getting started with Grafana Loki (Grafana Office Hours #09)

Senior Principal Solutions Engineer Ward Bekker talks about getting started with Grafana Loki: what Loki is, why you need log aggregation, and how it fits into the rest of the Grafana stack. He is joined by Developer Advocates Paul Balogh and Nicole van der Hoeven to tell you everything you need to know about Loki.