Operations | Monitoring | ITSM | DevOps | Cloud
Real user monitoring with Grafana (Grafana Office Hours #17)
Exoprise Launches Virtual Desktop Diagnostics Combining Synthetics and Real-User Monitoring
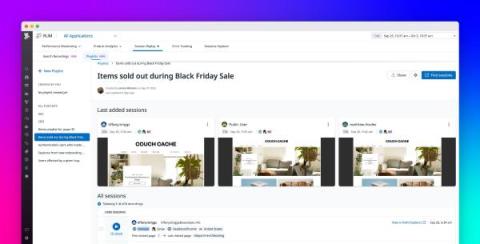
Organize and analyze related session replays with Playlists in Datadog RUM
Datadog Session Replay in Real User Monitoring (RUM) enables customers to capture and visually replay the web and mobile experience of their end users. With Session Replay, customers can quickly find and address UX errors by seeing precisely what actions an end user took, the point where they got stuck, and the outcome encountered as a result. Session Replay allows for easier troubleshooting and debugging because it delivers visible, insightful context into frontend errors.
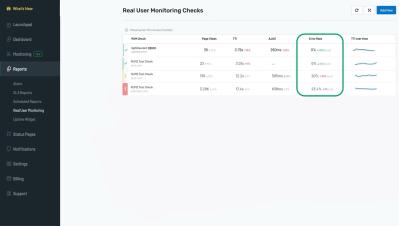
Real User Monitoring Dashboard
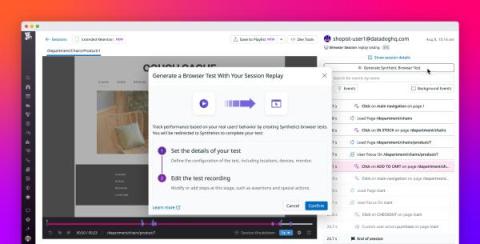
Create browser tests directly from Datadog RUM Session Replay
Testing is a key part of application development and helps you maintain a reliable experience for your users. But the process can be difficult to scale and is often siloed to a single team or individual that does not have broad knowledge of your application’s UI. This can lead to organizations investing in sizable test suites that do not accurately represent real user behavior.
The Complementary Power of RUM & Internet Synthetic Monitoring
User expectations are at an all-time high, and any performance hiccups can lead to frustrated users and lost business opportunities. To get real-time insights into their digital assets and succeed in this competitive landscape, businesses need Internet Performance Monitoring (IPM) that incorporates both synthetic and Real User Monitoring (RUM). RUM and synthetics are two powerful tools that, when used in tandem, offer a comprehensive view of performance and user experience.
Strong Security Should Not Mean Slow Performance
The security threat vector has become wider and deeper as technology has advanced. Enterprises put a series of tools in place that attempt to close up the many possible holes. But it's not all smooth sailing for everyone. Slow performance due to security measures and high overhead can impact employee productivity.
How to Install Sematext Experience on WordPress | Real User Monitoring on WordPress
Real user monitoring in Grafana Cloud: Get frontend error tracking, faster root cause analysis, and more
The frontend of a web application is the part that users directly interact with. It’s the last mile of the digital service you deliver to your customers and it’s directly associated with customer satisfaction and business objectives. Knowing performance metrics such as CPU or memory is helpful, but at the end of the day, what you care most about is if the user experience is affected.


