Operations | Monitoring | ITSM | DevOps | Cloud
Monitoring
The latest News and Information on Monitoring for Websites, Applications, APIs, Infrastructure, and other technologies.
Splunk Tutorials: Getting Started Using Splunk
Whether you are new to Splunk or just needing a refresh, this post can guide you to some of the best resources on the web for using Splunk. We’ve gathered, in a single place, the tutorials, guides, links, and even books to help you get started with Splunk.
What is observability? Best practices, key metrics, methodologies, and more
Sometimes the simplest questions prompt the most spirited discussion. Questions like: What is the airspeed velocity of an unladen swallow? What should we have for dinner tonight? Or, as we find out in this episode of “Grafana’s Big Tent" what even is observability?
More support for structured logs in new version of Go logging library
The new version of the Google logging client library for Go has been released. Version 1.5 adds new features and bug fixes including new structured logging capabilities that complete last year's effort to enrich structured logging support in Google logging client libraries. Here are few of the new features in v1.5: Let's look into each closer.
Go Instrumentation - Implementing Distributed Tracing in a Golang Application
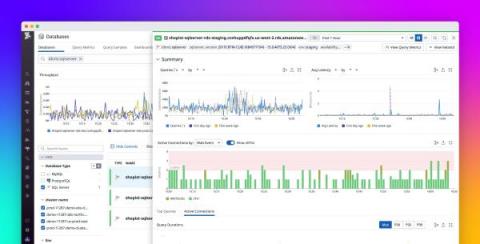
Analyze wait events and in-flight queries with the Datadog Database List
When you’re operating databases at scale, being able to get real-time insights across all your databases is essential for addressing issues and identifying areas for optimization. Datadog Database Monitoring’s Database List allows you to monitor your entire database fleet in one place, so you can quickly identify and troubleshoot overloaded hosts and gauge the impact of problematic queries throughout your infrastructure.
What to look for in a Windows network monitoring tool
Monitoring the Windows devices in a network is difficult yet essential since the devices are tasked with the critical functioning of the network. The challenges and complexity increase multi-fold for an enterprise network because each device is associated with many events, services, and processes that must be monitored to ensure the hassle-free operation of both the devices and the network. The devices should be monitored constantly by a network monitoring tool.
Your Telemetry Data is Faster, Is Your Analysis?
Continuous intelligence (CI) platforms can be used to collect telemetry data from various sources, perform analysis on that data, make inferences about the data, and provide real-time insights that help businesses understand what’s going on. For years, network, application performance, and security monitoring were fairly passive operations. Systems collected key telemetry data, and operators received alerts when a particular metric crossed a preset threshold. Operations were limited in two ways.
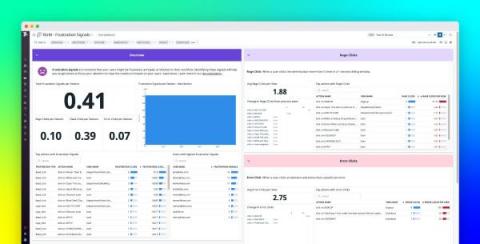
Detect user pain points with Datadog Frustration Signals
Whether you run an ecommerce site, a digital publication, or any other customer-facing service, delivering optimum user experiences is key to the success of your business. Customers can grow frustrated and abandon your site when they run into hurdles such as JavaScript errors or confusing page designs, and that frustration negatively impacts your company’s bottom line.


