Operations | Monitoring | ITSM | DevOps | Cloud
Monitoring
The latest News and Information on Monitoring for Websites, Applications, APIs, Infrastructure, and other technologies.
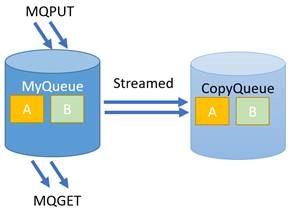
IBM MQ Streaming Queues Adds Business Value to Middleware
Last year we published this blog post about the benefits of IBM MQ streaming queues. On July 15th, 2022 this functionality was also made available for MQ on the mainframe (z/OS) and it’s also been announced for the MQ appliance for Aug 2nd, 2022. Nastel has been supporting and embracing this functionality for some time in its integration infrastructure management (i2M) platform.
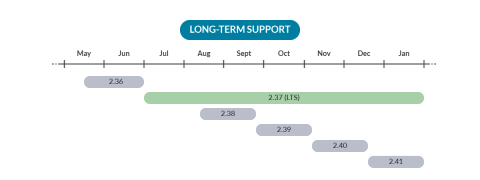
Prometheus 2.37 - The first long-term supported release!
Prometheus 2.37 is out and brings exciting news: this is the first long-term supported release. It’ll be supported for at least six months.
Content Delivery Networks (CDNs) vs. Load Balancers: What's The Difference?
Load balancers and content delivery networks (CDNs) are critical tools for delivering modern, cloud-native applications. They play essential roles in ensuring the smooth flow of data between applications and end-users. If you don’t have both a load balancer and a CDN in place, you’re probably in a poor position to guarantee the uptime of your application across a wide geographic area. That does not mean, however, that load balancers and CDNs do the same thing.
New in Grafana 9: The Prometheus query builder makes writing PromQL queries easier
When Grafana started in 2014, its main goal was to be a great dashboarding solution for Graphite. Around the same time, the Prometheus project started to gain steam, but it wasn’t clear whether it should be added to Grafana. After all, Grafana was a Graphite frontend, it was uncertain at the time if Prometheus would take off in popularity, and it would take resources away from the core purpose of why Grafana was created.
The Observability Maturity Model Webinar | StackState, TechStrong Research, Ripple X
Getting Started With Observability on Kubernetes | Webinar with Ricardo Santos and Andreas Prins
Observability Again? Oh, Yes.
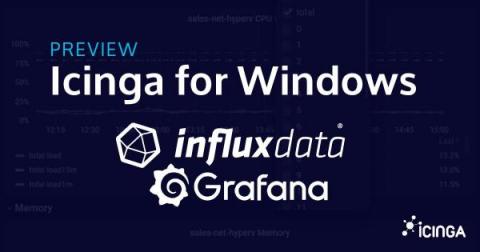
Icinga for Windows Preview: Visualize your Metrics!
It has been a while since we published some news regarding Icinga for Windows – that’s why we would like to tell you one month ahead about a big change which follows with version 1.10 in August.
MTTR vs. MTTA vs. MTBF: A Complete Set of Common Incident Management Metrics
There are a common set of key performance indicators for incident management, such as MTTR and MTTA. What do these metrics mean, and why are they important?


