Operations | Monitoring | ITSM | DevOps | Cloud

Monitoring

The latest News and Information on Monitoring for Websites, Applications, APIs, Infrastructure, and other technologies.

Kubernetes Monitoring: Best Practices and Essential Tools

As Kubernetes adoption continues to surge across various industries, the need for robust monitoring solutions is more critical than ever. Effective Kubernetes monitoring not only ensures the health and performance of your containerized applications but also provides valuable insights for troubleshooting and optimizing your infrastructure. However, Kubernetes's distributed and dynamic nature presents unique challenges regarding monitoring and observability.

Avoid Observability Failure

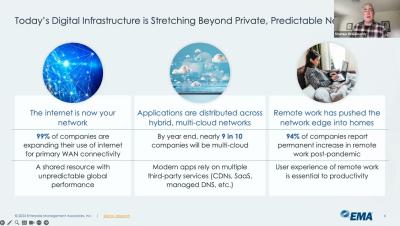
The public Internet is now a core component of every company’s digital architecture. Given its nature as a shared resource, the Internet is also the biggest variable in digital experience today. Therefore, application performance management solutions, which typically monitor application transactions and the cloud infrastructure that applications reside upon, can only offer IT operations teams a partial view of the overall health and performance of digital services. IT organizations must modernize their observability toolsets with Internet Performance Monitoring solutions.

Mastering Observability with OpenSearch: A Comprehensive Guide

Observability is the ability to understand the internal workings of a system by measuring and tracking its external outputs. In technical terms, it entails collecting and examining data from numerous sources within a system to attain insights into its behavior, performance, and health. All organizations are now familiar with how essential observability is to ensure optimal performance and availability of their IT infrastructure.

Navigating the Mainframe Logging Maze: Insights for the Modern IT Professional

Mainframes might seem like relics of a bygone era to many of us in 2024, but the truth, however, is far from that. Despite their reputation as ancient behemoths—and frequent targets of jokes—mainframes continue to be vital powerhouses driving the global economy. Their capability to process billions of transactions daily, including the majority of credit card transactions, underscores their enduring significance.

Datadog Pricing Explained: A 2024 Guide

In today’s fast-paced cloud environment, understanding the pricing model of some of the best cloud monitoring tools like Datadog is essential in optimizing costs. With several features and adaptable pricing, clarifying Datadog costs and aligning them with your organization’s operational needs is vital for fully harnessing this robust monitoring tool. This guide simplifies Datadog pricing, offering a clear overview of its cost structure.

How to visualize your network using topology maps

Topology maps offer a comprehensive overview of your entire network through a single console, enabling you to respond quickly to any issues that may arise. You can create custom network maps that arrange your network devices and their connections logically and hierarchically over a predefined or custom background so you can visualize how your network is structured and how it operates.

NiCE Active 365 Management Pack 4.3 for Microsoft SCOM and Azure

We are thrilled to announce the release of the latest version of the NiCE Active 365 Management Pack v4.3 for Microsoft SCOM, packed with exciting features and enhancements based on valuable feedback from our customers like you. Our focus on optimizing Azure Monitoring, refining naming conventions, and enhancing collector performance ensures a seamless monitoring experience tailored to your needs.

Announcing AI Error Resolution

After months of anticipation (and invaluable input from our beta testers!) we’re so excited to officially share AI Error Resolution. We can say firsthand that this tool helps developers resolve issues with renewed speed and accuracy, using AI-powered suggestions on the root cause of errors and how to fix them. Testing has shown how effectively this feature can pinpoint the source of an error and produce the most efficient method to resolve it, accelerating the entire debugging process.

Every second counts in our UI

Downtime has always been shown in minutes, hours, and days but for shorter downtimes you would see "0m" even if the actual downtime was less than a minute. We've updated the UI to show downtime in seconds. This means no more manually calculating brief outages — you’ll see exactly how long the system was down :) Did you know you can add notes to downtime periods?

How to Monitor & Identify Google Meet Performance Issues

Virtual meetings have become essential for businesses, connecting teams and enabling collaboration from anywhere. Google Meet has been a reliable platform for these meetings, but ensuring smooth performance requires some know-how. In this article, we'll break down how to monitor and identify Google Meet performance issues. Whether you're an IT professional, network admin, or remote user, this guide is tailored to help you optimize your virtual meetings.