Operations | Monitoring | ITSM | DevOps | Cloud

Monitoring

The latest News and Information on Monitoring for Websites, Applications, APIs, Infrastructure, and other technologies.

Motadata: Correlate Integrate Analyze your IT Infrastructure Stack

Motadata platform is built for every member of your IT team to monitor, track and deliver great business services. Upgrade your existing monitoring tools with one unified analytics platform for performance monitoring, network behavior analytics, log management and SIEM. To provide uninterrupted services to the users, operational team need correlated data, integrations across the board to collect & automate, analytics capabilities to monitor & visualize critical metrics which allows making more informed decisions. Motadata platform can help you do just that – Correlate, Integrate and Analyze IT infrastructure stack.

Sean Porter | DATA COLLECTION & PROMETHEUS SCRAPING WITH SENSU 2.0

Sean will demonstrate how Sensu 2.0 is designed to collect monitoring and telemetry data from these heterogeneous environments and store them in InfluxDB. Sensu 2.0 is the next release of the open source monitoring framework, rewritten in Go, with new capabilities and reduced operational overhead. Using Sensu alongside InfluxDB, Sean will go over various patterns of data collection, including scraping Prometheus metrics, and show how Sensu enables self-service data collection for service owners.

Nathaniel Cook | KAPACITOR STREAM PROCESSING

Kapacitor is the brains of the TICK Stack. Nathaniel will cover the stream processing capabilities of Kapacitor, how to process data before it gets stored in InfluxDB and after it is stored, best practices around anomaly detection and machine learning. In addition, Nathaniel will discuss how to configure the clustered version of Kapacitor.

David Cromberge | WHY YOU DEFINITELY DON'T WANT TO BUILD YOUR OWN TIME SERIES DATABASE

At Outlyer, an infrastructure monitoring tool, we had to build our own TSDB back in 2015 to support our service. Two years later, we decided to take a different direction after seeing for ourselves how hard it is to build and scale a TSDB. This talk will review our journey, the challenges we hit trying to scale a TSDB for large customers and hopefully talk some people out of trying to build one themselves because it is not easy!

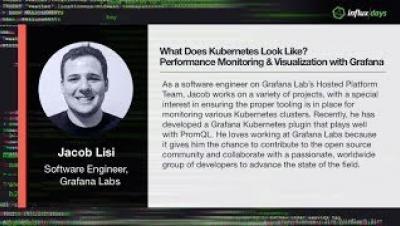
Jacob Lisi | WHAT DOES KUBERNETES LOOK LIKE?: PERFORMANCE MONITORING & VISUALIZATION WITH GRAFANA

Monitoring Kubernetes is vital to understanding the health and performance of a cluster, but which metrics are most important to add to your dashboards and alert on? Jacob will discuss how to most effectively monitor and visualize your Kubernetes cluster using the Grafana Kubernetes plugin and PromQL.

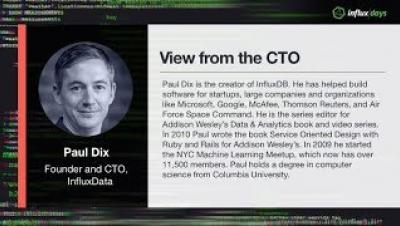
Paul Dix | INFLUXDATA PLATFORM FUTURE AND VISION

Paul will outline his vision around the platform and give the latest updates on IFQL ( a new query language), the decoupling of query and storage, the impact of hybrid cloud environments on architecture, cardinality, and discuss the technical directions of the platform. This talk will walk through the vision and architecture with demonstrations of working prototypes of the projects.

Colin Breck | FROM A TIME-SERIES DATABASE TO A KEY OPERATIONAL TECHNOLOGY FOR THE ENTERPRISE

It is important for a time-series database to provide efficient storage, aggregation, and query of time-series data. Elevating a time-series database to a core operational technology of the enterprise, however, involves so much more. In this talk, I will explore important considerations that take a time-series database from being just another data-store, to a critical infrastructure for operational intelligence.