Operations | Monitoring | ITSM | DevOps | Cloud


The latest News and Information on Monitoring for Websites, Applications, APIs, Infrastructure, and other technologies.
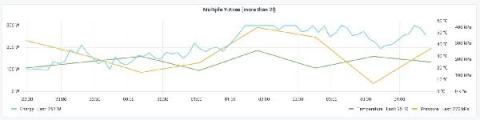
How the new time series panel brings major performance improvements and new visualization features to Grafana 7.4
In Grafana 7.0, we introduced a new panel architecture to enhance the UX and visualization options and create a more consistent experience across Grafana. In Grafana 7.4, we expanded on that foundation and introduced the next-generation graph panel called Time series panel, which is currently in beta. The Time series panel uses the panel architecture of Grafana 7.0 and integrates with field options, overrides, and transformations.

Application Monitoring 101: How Grouping works in Sentry

Application Monitoring 101: How to improve stack trace Grouping

Application Monitoring 101: Server-side fingerprint rules

Application Monitoring 101: SDK-side fingerprint rules

Observability vs. Monitoring - What's the Difference?
Elastic 7.11 released: General availability of searchable snapshots and the new cold tier, and the beta of schema on read
We are pleased to announce the general availability (GA) of Elastic 7.11. This release brings a broad set of new capabilities to our Elastic Enterprise Search, Observability, and Security solutions, which are built into the Elastic Stack — Elasticsearch and Kibana. This release enables customers to optimize for cost, performance, insight, and flexibility with the general availability of searchable snapshots and the beta of schema on read.

Elastic Stack alerting now generally available
We are thrilled to announce the general availability of alerting in the Elastic Stack with the release of 7.11. With deep integrations throughout our products and solutions, a laser focus on distinguishing signal from noise, and tie-ins to the third-party platforms you depend on like email, PagerDuty, ServiceNow, and Microsoft Teams, building, using, and acting on alerts in Elastic has never been more powerful.

Why CSPs Need to Shift Focus to Service Experience Monitoring
The past twelve months have pushed many communication service providers (CSPs) to the limit. According to financial reports of the last six months, the New Normal brought about by the pandemic has significantly increased network expansion efforts, IoT connections, new broadband customers, and out of bundle voice traffic and mobile data.