Operations | Monitoring | ITSM | DevOps | Cloud

Monitoring

The latest News and Information on Monitoring for Websites, Applications, APIs, Infrastructure, and other technologies.

How to monitor Lambda with CloudWatch Metrics

With AWS Lambda, you have basic observability built into the platform with CloudWatch. CloudWatch offers support for both metrics and logging. CloudWatch Metrics gives you basic metrics, visualization and alerting while CloudWatch Logs captures everything that is written to stdout and stderr. In this post, we will take a deep dive into CloudWatch Metrics to see how you can use it to monitor your Lambda functions and its limitations.

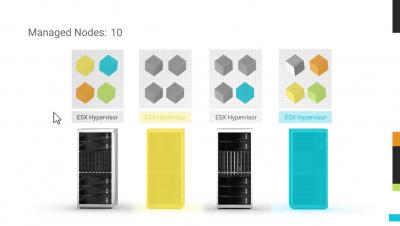
8 server types you should know about

How many server types are out there? The answer to this question, like so many others, is: “It depends”. Since there can be as many types of server as a company needs, and companies have more IT needs every day, so… If we go to the definition of server we find that this is a computer that provides service to other computers that are part of a network.

Velocity (& Reliability) - Two must-haves for every software engineering team

(Field notes from O’Reilly’s Velocity 2019 Show, San Jose.) It was steamy hot in San Jose during O’Reilly’s Velocity show and the normally frigid AC temps in the expo hall were welcomed by all attendees, escaping the 104 degree temps. It got so bad, Charity Majors labeled it Satan Jose and the nearby Marriott hotel experienced a power outage for almost two full days, leaving guests hot under more than just their collars.

Chaos engineering + monitoring, part 1: Sensu + Gremlin

One of my earliest jobs was as an admin for an MSP. We'd routinely generate alerts that weren't actionable, lacked context, and for most of our customers, were considered noise. From a monitoring perspective, it was bad. Customers didn't trust in the alerts they received and often resorted to having some additional monitoring product installed on their systems. It's safe to say that our auto-generated tickets and emails were largely ignored.

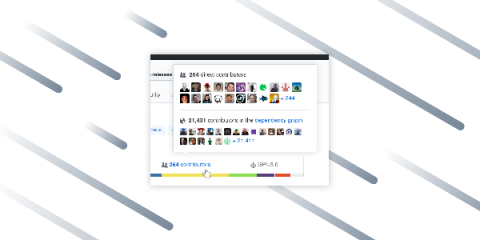
How to inspire exceptional contributions to your open-source project

Netdata must be doing something right when it comes to inspiring contributions. Our open-source, distributed monitoring agent has on GitHub and has seen contributions from hundreds of people: . We’ve even hired a handful of our contributors to work full-time on making the Netdata ecosystem even more powerful. The community is passionate about what we’re building, and they’re actively interested in making it work better for their particular needs.

Apache Tomcat Monitoring with ELK and Logz.io

Apache Tomcat is the most popular application server for serving Java applications. Widely-used, mature and well documented, Tomcat can probably be defined as the de-facto industry standard. Some sources put Tomcat’s market share at over 60%! Tomcat is particularly popular for serving smaller applications since it doesn’t require the full Java EE platform. It consumes a relatively small amount of resources and provides users with simpler admin features.

2019 PHP Monitoring Options

There is no denying the popularity of PHP. It has been a constant force in the web development world since its release way back in 1995. And now in 2019, thanks to Laravel, it is still going as strong as ever! Here at Scout, recently we have been working hard on providing a PHP performance monitoring agent to sit alongside our existing ruby, python and elixir agents.

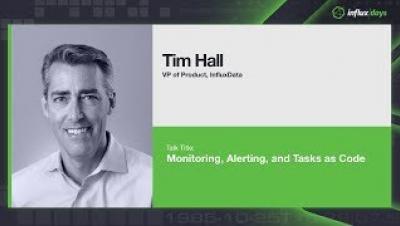
Tim Hall [InfluxData] | Dashboards as Code | InfluxDays London 2019

We are all used to building dashboards for great visualizations, but the issue becomes how to share and collaborate on instrumentation and dashboard design. In this talk, Tim Hall will drill down on dashboard sharing, how to iterate and improve on dashboards within a repository, and lessons learned in sharing and collaborating on dashboards.