Operations | Monitoring | ITSM | DevOps | Cloud

Monitoring

The latest News and Information on Monitoring for Websites, Applications, APIs, Infrastructure, and other technologies.

How To Track Timeouts In Honeybadger

The other day a long-time customer wrote in with a problem. They use Honeybadger to monitor their Ruby apps for exceptions but were having trouble catching timeouts. If their app took too long to respond, their application server, Puma, would abort the request. The only insight their team had into this problem was through Puma's logs. Most people consider timeouts to be a kind of error, so it'd be nice to have them reported by Honeybadger like any other errors.

Pro Tips: How to Decrease MTTR and Increase Uptime with Grafana and VictorOps

We can sift through oceans of data. Alert on predetermined parameters. Deliver multiple commits a day. But as organizations leverage these layered, complex monitoring systems, “we also have to start practicing observability to enrich the actions that we take to solve problems as they occur and drive continual improvement,” said VictorOps Product Marketing Manager Melanie Postma. VictorOps is one tool that can help accomplish that.

Pro Tips: How Amgen Manages On Calls (and Burnout) with Grafana

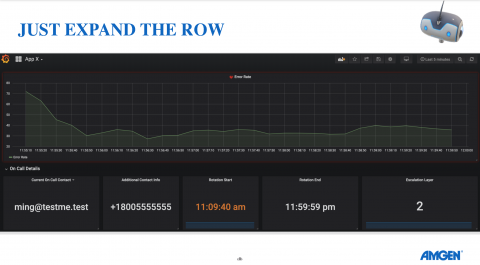
There is a lot of talk about graphing all the things, but have you ever considered graphing all the people – in particular their on calls – as well? “Not letting people burnout on call is something that is being talked about in the industry,” said Jordan J. Hamel, Design Engineer at the biotech company Amgen.

How to manually build a Ubuntu 18.04 Virtual Machine server with Oracle VirtualBox

This post will describe how to manually build a Ubuntu 18.04 Virtual Machine (VM) server using Oracle’s VirtualBox virtualisation software. Being able to build simple, expendable VMs is extremely useful, whether you’re writing software, building websites or just wanting to learn about Linux servers. We need to be able to SSH onto the server from our host machine to make access easier. To gain SSH access we therefore need to forward SSH’s port to our host.

Ultimate Serverless Benchmark. AWS Lambda Vs. All (Azure, Google, IBM, Alicloud, and Oracle)

We currently have six major cloud platforms offering serverless products, AWS Lambda being the pioneer. Our goal is to provide a quick way to compare and evaluate all. For each service, we will be evaluating: There are smaller service providers on the market that are focused on serverless, but we won’t cover them in the present analysis. For the pricing comparison, we considered regions in the United States east coast. Let the battle begin!

Using Lambda Layers for Better Serverless Architecture

Lambda Layers were introduced by AWS in late 2018 as a way to simplify the developer’s life when managing dependencies and shared resources across a multi-Lambda stack. It’s a versatile feature that brings many benefits, which we will discuss in this article. Using Lambda Layers does increase complexity to monitor and maintain your applications, but there’s no need to fear.

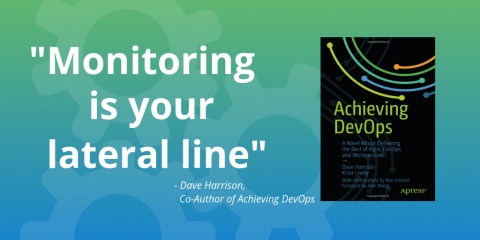
'Monitoring is your lateral line', and more from the new book 'Achieving DevOps'

The following article is an excerpt from the book Achieving DevOps, a novel about delivering the best Agile, DevOps and Microservices, written by Dave Harrison and Knox Lively. This article is published with the author’s permission. A lateral line is how a fish monitors the surrounding water for changes in pressure, allowing it to understand the environment. This is how fish can survive in a very harsh, always-changing environment; without it, the fish is ‘blind’ and cannot survive.

Kubernetes Control Plane monitoring with Datadog

In a Kubernetes cluster, the machines are divided into two main groups: worker nodes and master nodes. Worker nodes run your pods and the applications within them, whereas the master node runs the Kubernetes Control Plane, which is responsible for the management of the worker nodes. The Control Plane makes scheduling decisions, monitors the cluster, and implements changes to get the cluster to a desired state.

How to Combine HTTP & API Monitoring for Your Website

An API check is comprised of multiple HTTP/S checks configured for uptime monitoring. In API monitoring, tracking latency and availability provide first notice of a potential problem. The same extends to general uptime monitoring, where serving the best and fastest user experience is critical. Functionally, an API and HTTP/S check might do the job of monitoring API endpoints. Both can post or expect strings in response, and both provide alert of downtime.

NiCE Enterprise Application Monitoring | Welcome to the data-driven world

From databases to servers, communication systems, operating systems and custom applications, NiCE provides the right monitoring solutions and services for your cloud, hybrid and on-premise hosted applications. get your fee copy today at www.nice.de/request