Operations | Monitoring | ITSM | DevOps | Cloud

Monitoring

The latest News and Information on Monitoring for Websites, Applications, APIs, Infrastructure, and other technologies.

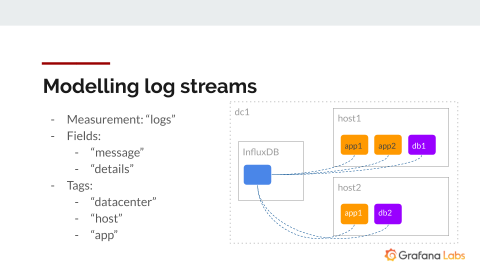
How to Mix Metrics and Logs with Grafana and Influx

It’s time to stop thinking of Grafana as a general dashboarding tool. “Grafana Labs is on a journey to becoming a developer’s observability platform to support your classic DevOps use cases,” said Grafana Labs’ Director of UX, David Kaltschmidt, at a recent talk given at the 2019 InfluxDays Conference in London.

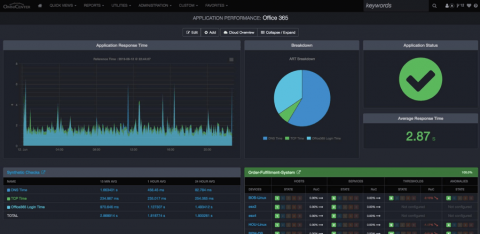
OmniCenter 12 Now Available: Extensible Integration, Unlimited Scalability, and Device Grouping

Today’s IT organizations are faced with the challenge of integrating new technology into their infrastructure while continuing to support all of their legacy needs. Building upon the host of features already present in our flagship product, Netreo is proud to announce the release of OmniCenter 12. The enhancements found in this latest release greatly furthers an administrator’s ability to get deep insight into resources across their entire IT landscape.

Making Instrumentation Extensible

Observability-driven development requires both rich query capabilities and sufficient instrumentation in order to capture the nuances of developers’ intention and useful dimensions of cardinality. When our systems are running in containers, we need an equivalent to our local debugging tools that is as easy to use as Printf and as powerful as gdb.

The Dollars and Sense of OpsRamp

Enterprise IT teams are dealing with the daily challenges of alert floods, point tool sprawl, and overwhelming hybrid complexity. The recent OpsRamp State of AIOps report indicated that IT professionals are using AIOps tools for productivity gains from intelligent alerting (69%), faster root cause analysis (61%), and better infrastructure performance through anomaly detection (55%).

Rails Geocoder: A Guide to Managing Locations in Your Apps

The introduction of Google Maps in 2005 changed the way we think about the internet. It’s hard to remember now, but there was a time where the internet was disconnected from the physical world. You might find a business’s website, and if you were lucky, they’d have an address included. A national chain of restaurants or grocery stores probably wouldn’t be able to tell you their nearest location to your home. All of that has changed, today.

How Do You Know if You Have a Slow Website?

With a shift toward the Internet of Things, where always-on connectivity is paramount, digital experience monitoring (DEM) is a transformational way of looking at application and end-user monitoring. DEM asks more than whether you have a slow website, it looks at how every step in the user’s experience performs at a granular level. This discipline measures the website’s response to the user’s needs.

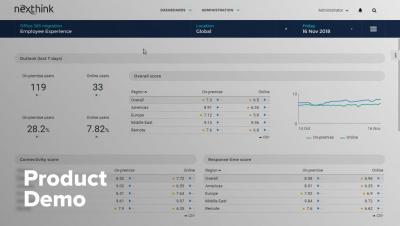
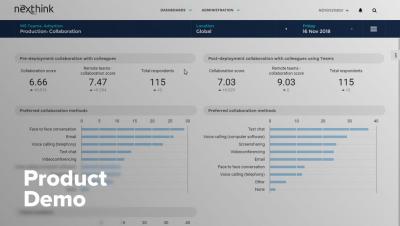
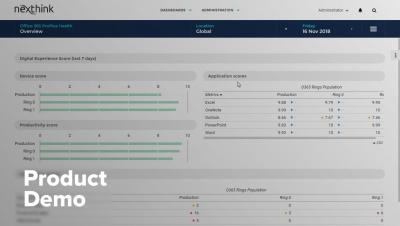
Office 365: Measuring employee experience during migration from on-premise to cloud | Product Demo

In this short product demo, watch how Nexthink provides IT with actionable insight and metrics over employees' actual experiences during migration effort of Office 365 services - such as SharePoint and Exchange - from on-premise to cloud.