Operations | Monitoring | ITSM | DevOps | Cloud

Monitoring

The latest News and Information on Monitoring for Websites, Applications, APIs, Infrastructure, and other technologies.

Retail Resilience: Lessons Learned from Cyber Week 2023

Black Friday and Cyber Monday this year marked a strong recovery for the retail and e-commerce sectors. Consumers were more eager to spend compared to 2022. Adobe Analytics highlights a significant jump in online sales, reaching $9.8 billion on Black Friday, up 7.5% from last year. Cyber Monday also saw an impressive rise, with sales hitting $12.4 billion, a 9.6% increase from 2022.

How AI Can Catalyze Digital Resilience: An Introduction to Splunk's Philosophy

ChatGPT and other LLMs have become so accessible that even our grandmas know about AI. But what’s really happening beyond the hype? Recently, I sat down with IT and security leaders Cory Minton and Kirsty Paine to share the inside scoop on how we’re thinking about AI here at Splunk. Watch the replay of our conversation here.

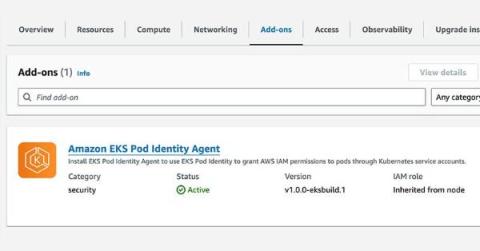
Exploring the new EKS Pod Identity Functionality

One announcement that caught my attention in the EKS space during this year’s AWS re:Invent conference was the addition of the Amazon EKS Pod Identities feature. This new addition helps simplify the complexities of AWS Identity and Access Management (IAM) within Elastic Kubernetes Service (EKS). EKS Pod Identities simplify IAM credential management in EKS clusters, addressing a problematic area over the past few years as Microservice adoption has risen across the industry.

Fleet & Discovery | Sematext

Sematext Cloud's Fleet and Discovery makes managing agent installations and setting up service and log monitoring a super simple task. It lets you see, troubleshoot and manage each agent, use logs for diagnostics, and set up which services or logs you want to be monitored. Don't miss out on the opportunity to streamline your monitoring workflow and ensure the optimal performance of your technology stack.

The World Needs Problem Solvers, Not Problem Identifiers

Last week we announced the release of new capabilities to proactively identify and address website and web application issues that may impact user experience or the functionality of the applications. The capability, called site availability monitoring (SAM), is immediately available to all customers.

Using VPC Flow Logs to Monitor AWS Virtual Public Cloud

While no man is an island, your Virtual Private Cloud (VPC) is, except it’s a digital island floating in the ocean of a public cloud offered by a cloud service provider (CSP). The VPC means that everything on your digital island is yours, and none of the CSPs other customers can (or should be able to!) access it. You’ve likely been introduced to the shared security model, a sometimes-confusing way that organizations and their cloud-services providers (CSPs) split security responsibilities.

The Advent of Monitoring, Day 10: Better Observability Into Your Local Clickhouse Instance With Grafana and Prometheus

Cloud-based database providers often provide great observability out of the box. But, what if you’re developing a tricky feature locally and need more details about what your local Clickhouse is doing? There are many options, but if you’re a numbers and graphs person like me, you’ll want to be able to view the inner workings of Clickhouse in something like Grafana.

Rollbar Alternatives: Compare Before You Commit

Rollbar is acclaimed as the top error monitoring tool - with 4.5 out of 5 stars on both Capterra and G2 - amongst a competitive field. That said, we recognize there are alternatives some people consider when also looking at us. Here is our perspective on what these other tools are for, and when to choose Rollbar instead.